A .gov website belongs to an official government organization in the United States.
Secure .gov websites use HTTPS
A lock () or https:// means you've safely connected to the .gov website. Share sensitive information only on official, secure websites.
Scientific Assessment of Ozone Depletion: 2010
Executive Summary Figure ES-1
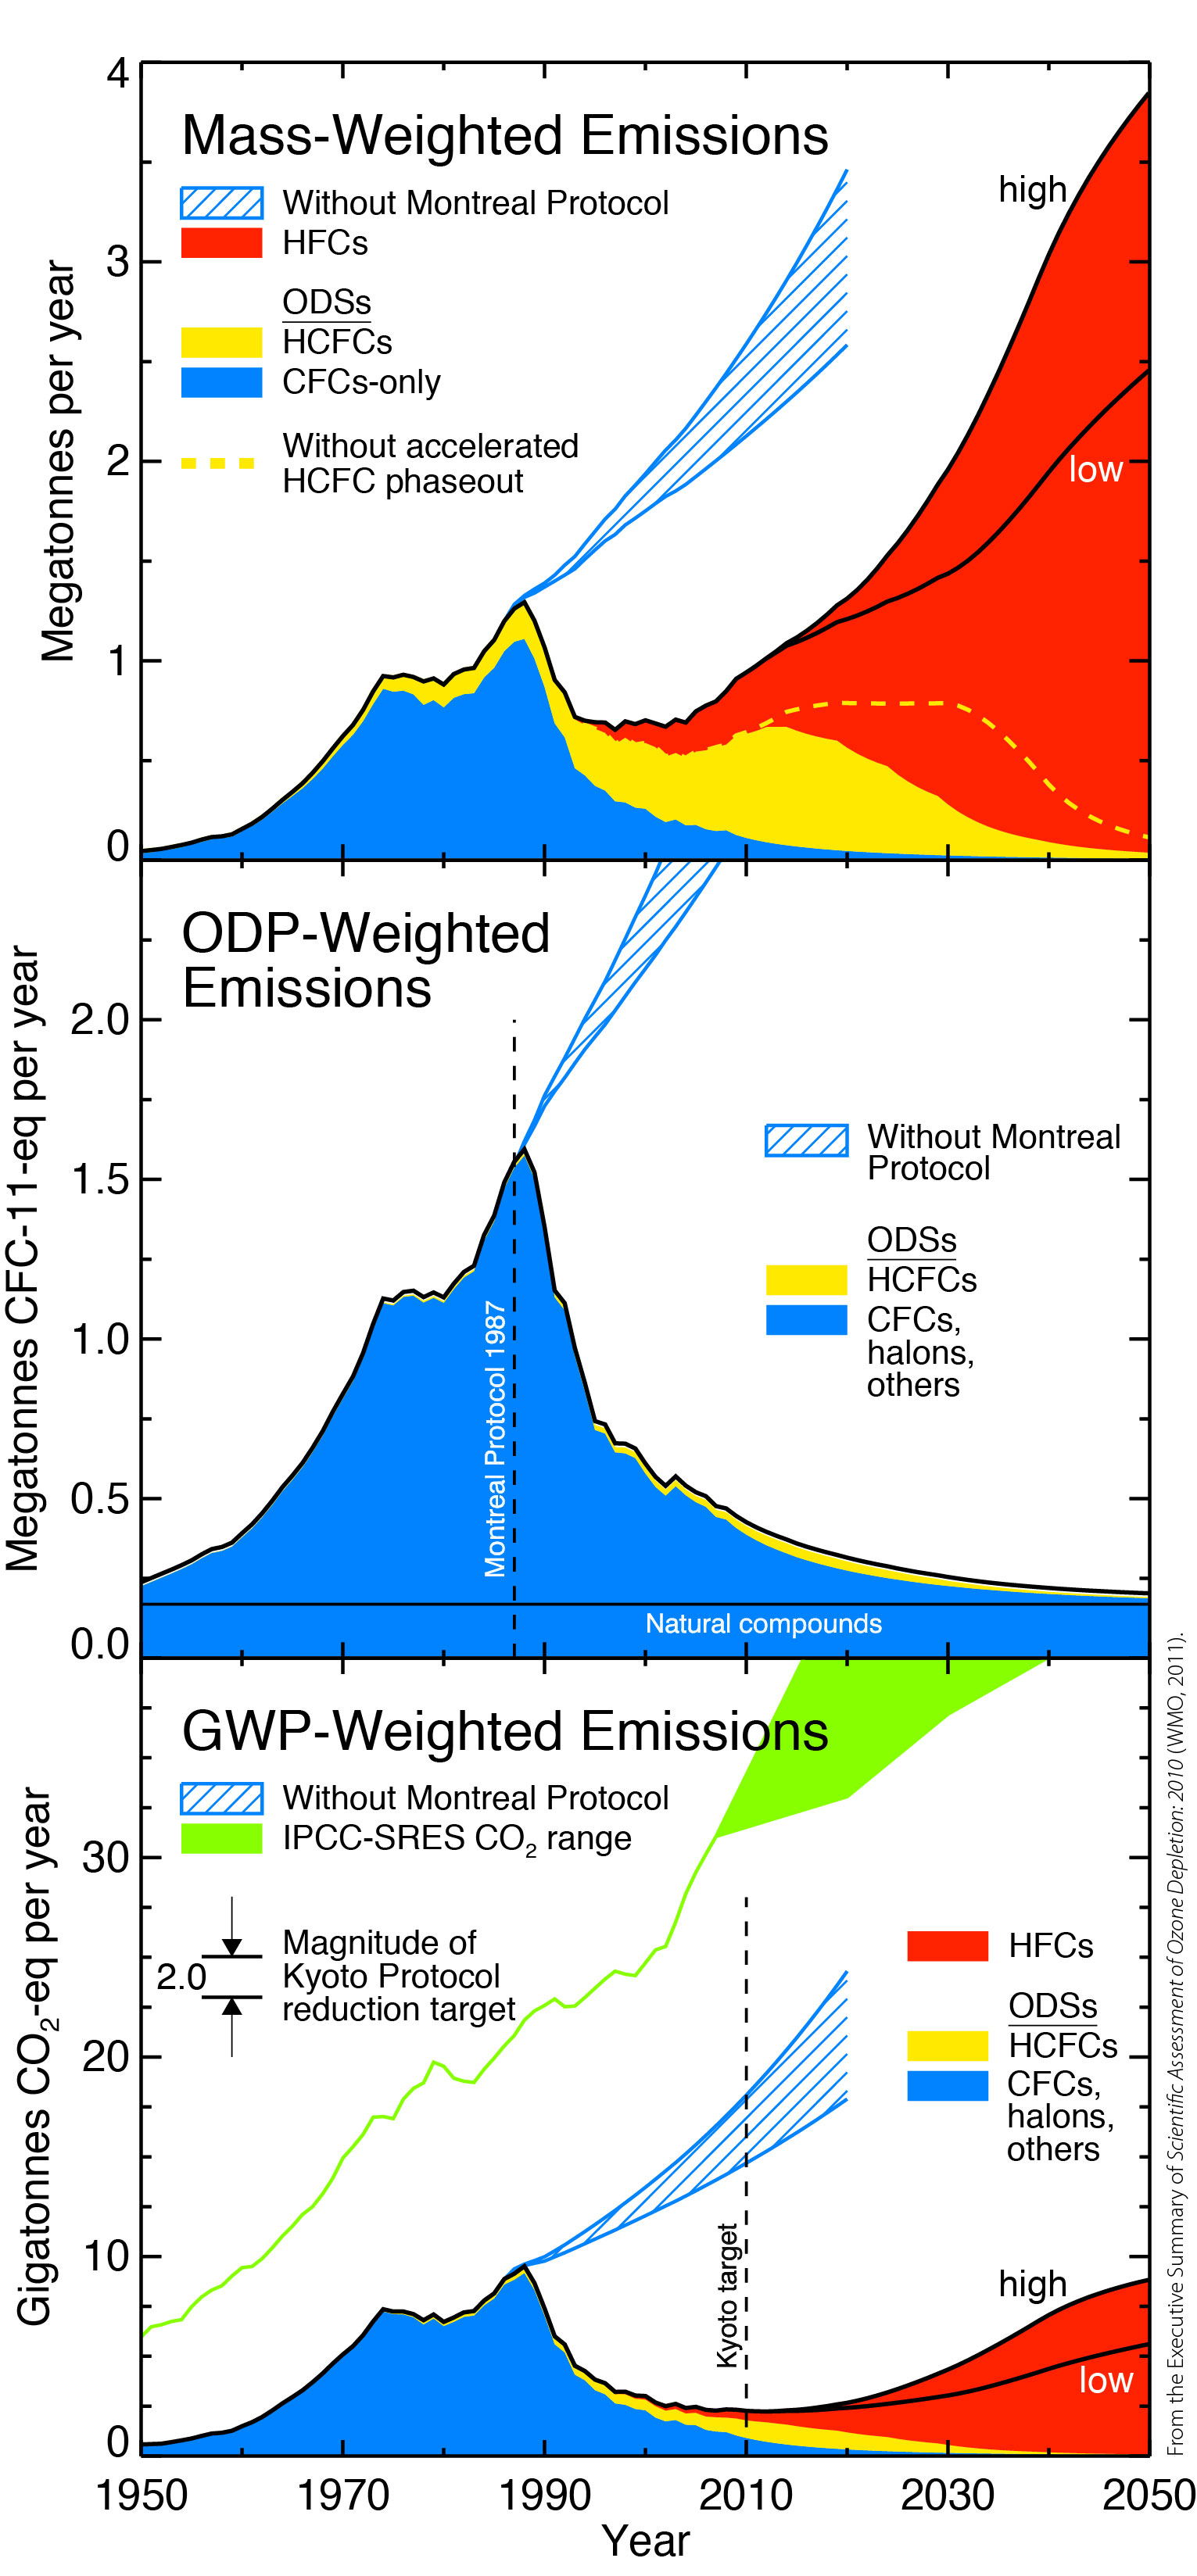
Figure ES-1: Emissions of ODSs and their substitutes.
Global emissions of ODSs (CFCs, halons, HCFCs, and others) and their non-ozone depleting substitutes (HFCs) from 1950 to 2050. Emissions are the total from developing and developed countries. The legends identify the specific groups of substances included in each panel. The high and low HFC labels identify the upper and lower limits, respectively, in global baseline scenarios. The blue hatched regions indicate the emissions that would have occurred, in the absence of the Montreal Protocol, with 2-3% annual production increases in all ODSs.
Top panel: Global mass-weighted emissions expressed as megatonnes per year. The yellow dashed line shows HCFC emissions calculated without the provisions of the 2007 accelerated HCFC phase-out under the Montreal Protocol.
Middle panel: Global Ozone Depletion Potential-weighted emissions expressed as megatonnes of CFC-11-equivalent per year. The emissions of individual gases are multiplied by their respective ODPs (CFC-11 = 1) to obtain aggregate, equivalent CFC-11 emissions. The dashed line marks 1987, the year of the Montreal Protocol signing.
Bottom panel: Global GWP-weighted emissions expressed as gigatonnes of CO2-equivalent per year. The emissions of individual gases are multiplied by their respective GWPs (direct, 100-year time horizon; CO2 = 1) to obtain aggregate, equivalent CO2 emissions. Shown for reference are emissions for the range of CO2 scenarios from the Intergovernmental Panel on Climate Change (IPCC) Special Report on Emission Scenarios (SRES). The CO2 emissions for 1950-2007 are from global fossil fuel use and cement production. Beyond 2007, the shaded region for CO2 reflects the maximum (A1B) and minimum (B2) SRES scenarios. The dashed line marks 2010, the middle year of the first commitment period of the Kyoto Protocol. Also shown is the magnitude of the reduction target of the first commitment period of the Kyoto Protocol, which is based on a 1990-2010 projection of global greenhouse gas emission increases and the reduction target for participating countries.