A .gov website belongs to an official government organization in the United States.
Secure .gov websites use HTTPS
A lock () or https:// means you've safely connected to the .gov website. Share sensitive information only on official, secure websites.
Scientific Assessment of Ozone Depletion: 2010
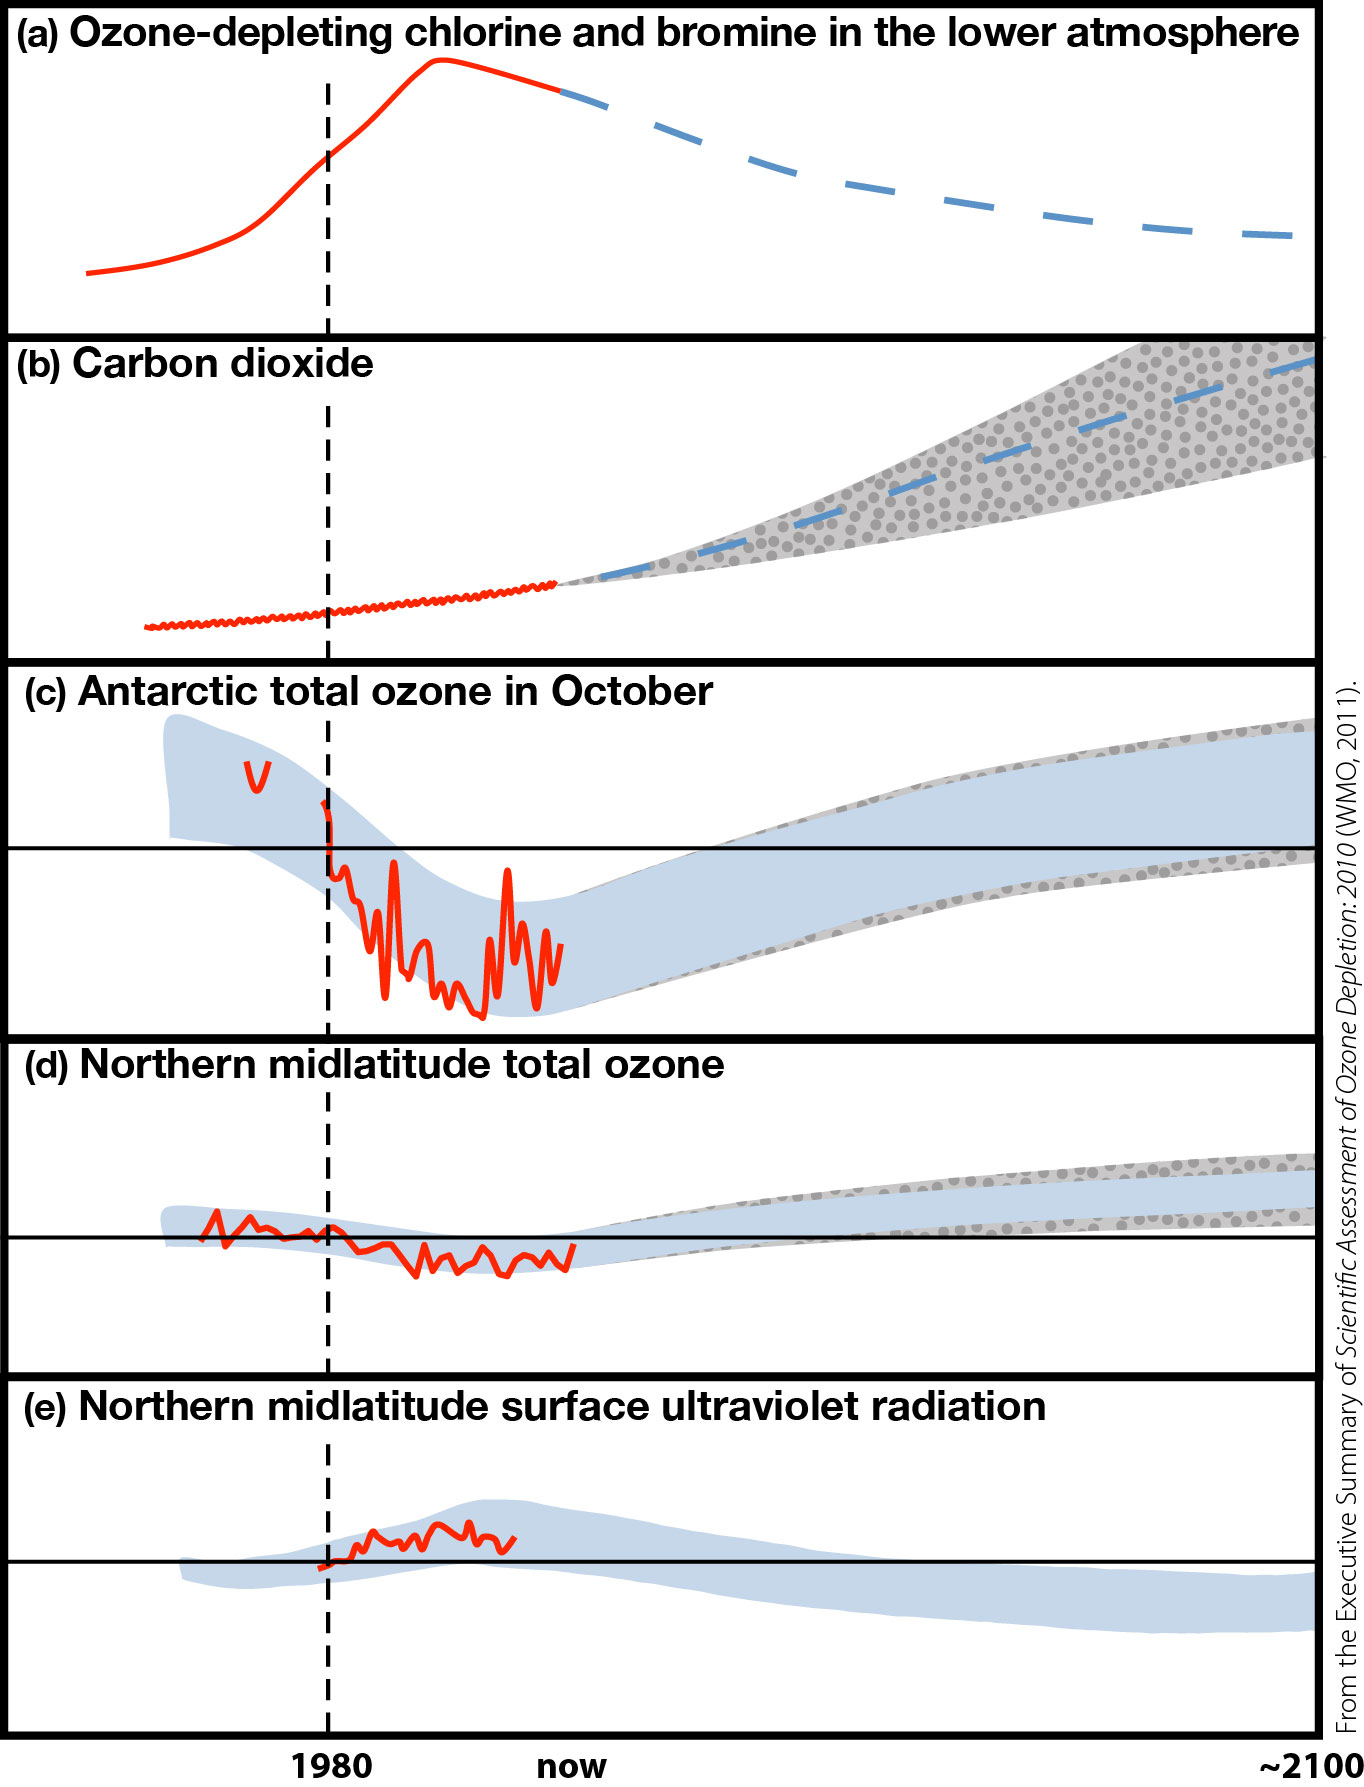
Executive Summary Figure ES-2
Figure ES-2. Schematic of the influence of ozone-depleting substances (ODSs) and climate change on the stratospheric ozone layer, and the influence of ozone changes on surface ultraviolet radiation.
The red lines are based on observations to date. The blue dashed lines represent one commonly accepted scenario for the future. Shaded areas represent year-to-year variability and uncertainties in simulations of the past and future. The dashed vertical line at 1980, a year used as a benchmark for ozone and UV recovery, demarcates the situation before and after significant changes to the ozone layer. The curve for carbon dioxide (CO2), a greenhouse gas important to Earth's climate, is shown because its changes can affect stratospheric temperatures as well as wind patterns, both of which affect stratospheric ozone.
(a) Combined effective abundance of ozone-depleting chlorine and bromine in the lower atmosphere (troposphere). The red line is a representation of the measured atmospheric abundances. The blue dashed line is the expected combined effective abundance of chlorine and bromine based on the most likely ODS scenario used in this report and current understanding of the workings of the atmosphere. Because of the Montreal Protocol, a continued decline is expected through the end of this century, with a return to the 1980 benchmark value occurring around the middle of this century. A similar curve for the stratosphere would be shifted to the right (later dates) by a few years because of the time lag in the transport of substances from the surface to the stratosphere.
(b) The atmospheric abundance of carbon dioxide, the major anthropogenic greenhouse gas that changes Earth's climate, including in the stratosphere; CO2 abundance is a proxy for climate change. The gray dotted/shaded area represents expectations of increasing future CO2 abundance based on different scenarios used in this Assessment.
(c) The extent of the Antarctic ozone hole, as measured by the amount of ozone in the total overhead column averaged for the month of October. The ozone hole is the clearest indicator of ozone layer depletion by ODSs, and the ODSs in the atmosphere have been and are expected to continue to be the primary control on the extent and duration of the ozone hole. Antarctic ozone is expected to return to pre-1980 benchmark values in the late 21st century. The blue shaded area shows the estimated year-to-year variability of ozone for one scenario that includes changes in ODSs (panel a), CO2 (panel b, blue dashed line), and changes in nitrous oxide and methane (not shown), but does not capture all uncertainties. The gray dotted/shaded area shows the uncertainty due to different climate scenarios, but again does not capture all uncertainties.
(d) The extent of northern midlatitude ozone depletion, as measured by the amount of ozone in the total overhead column between 30°N and 60°N averaged over each year; blue and gray shaded areas as in panel c. Panels c and d show the approximate relative magnitudes of the northern midlatitude ozone depletion and the Antarctic ozone hole. Influences of the quasi-biennial oscillation (QBO), volcanoes, and solar cycle have been removed from the observational data. The future projections do not include the influence of any volcanic eruptions or solar cycle variations. Natural variability makes it difficult to identify the projected return of northern midlatitude ozone levels to pre-1980 levels, but the expectation is that climate change will hasten this return by several decades, such that it will occur before the middle of the 21st century (before the return of stratospheric chlorine and bromine to the 1980 benchmark value, and before the return of Antarctic ozone, panel c).
(e) Changes in clear-sky surface UV radiation at northern midlatitudes that accompany the ozone changes of the ODS scenario above. Because the ozone depletion in the northern midlatitudes has been small, the UV changes also have been small. The blue shaded area shows the year-to-year variability of surface UV for the ozone changes of panel d. Clouds, aerosols, and air pollution significantly affect surface UV, but it is difficult to project their future changes. The uncertainties in these changes, which are larger than the uncertainties due to ozone changes, are not represented in the figure. The expectation is that climate change will result in northern midlatitude clear-sky surface UV radiation levels well below 1980 values by the second half of this century.