A .gov website belongs to an official government organization in the United States.
A lock () or https:// means you've safely connected to the .gov website. Share sensitive information only on official, secure websites.
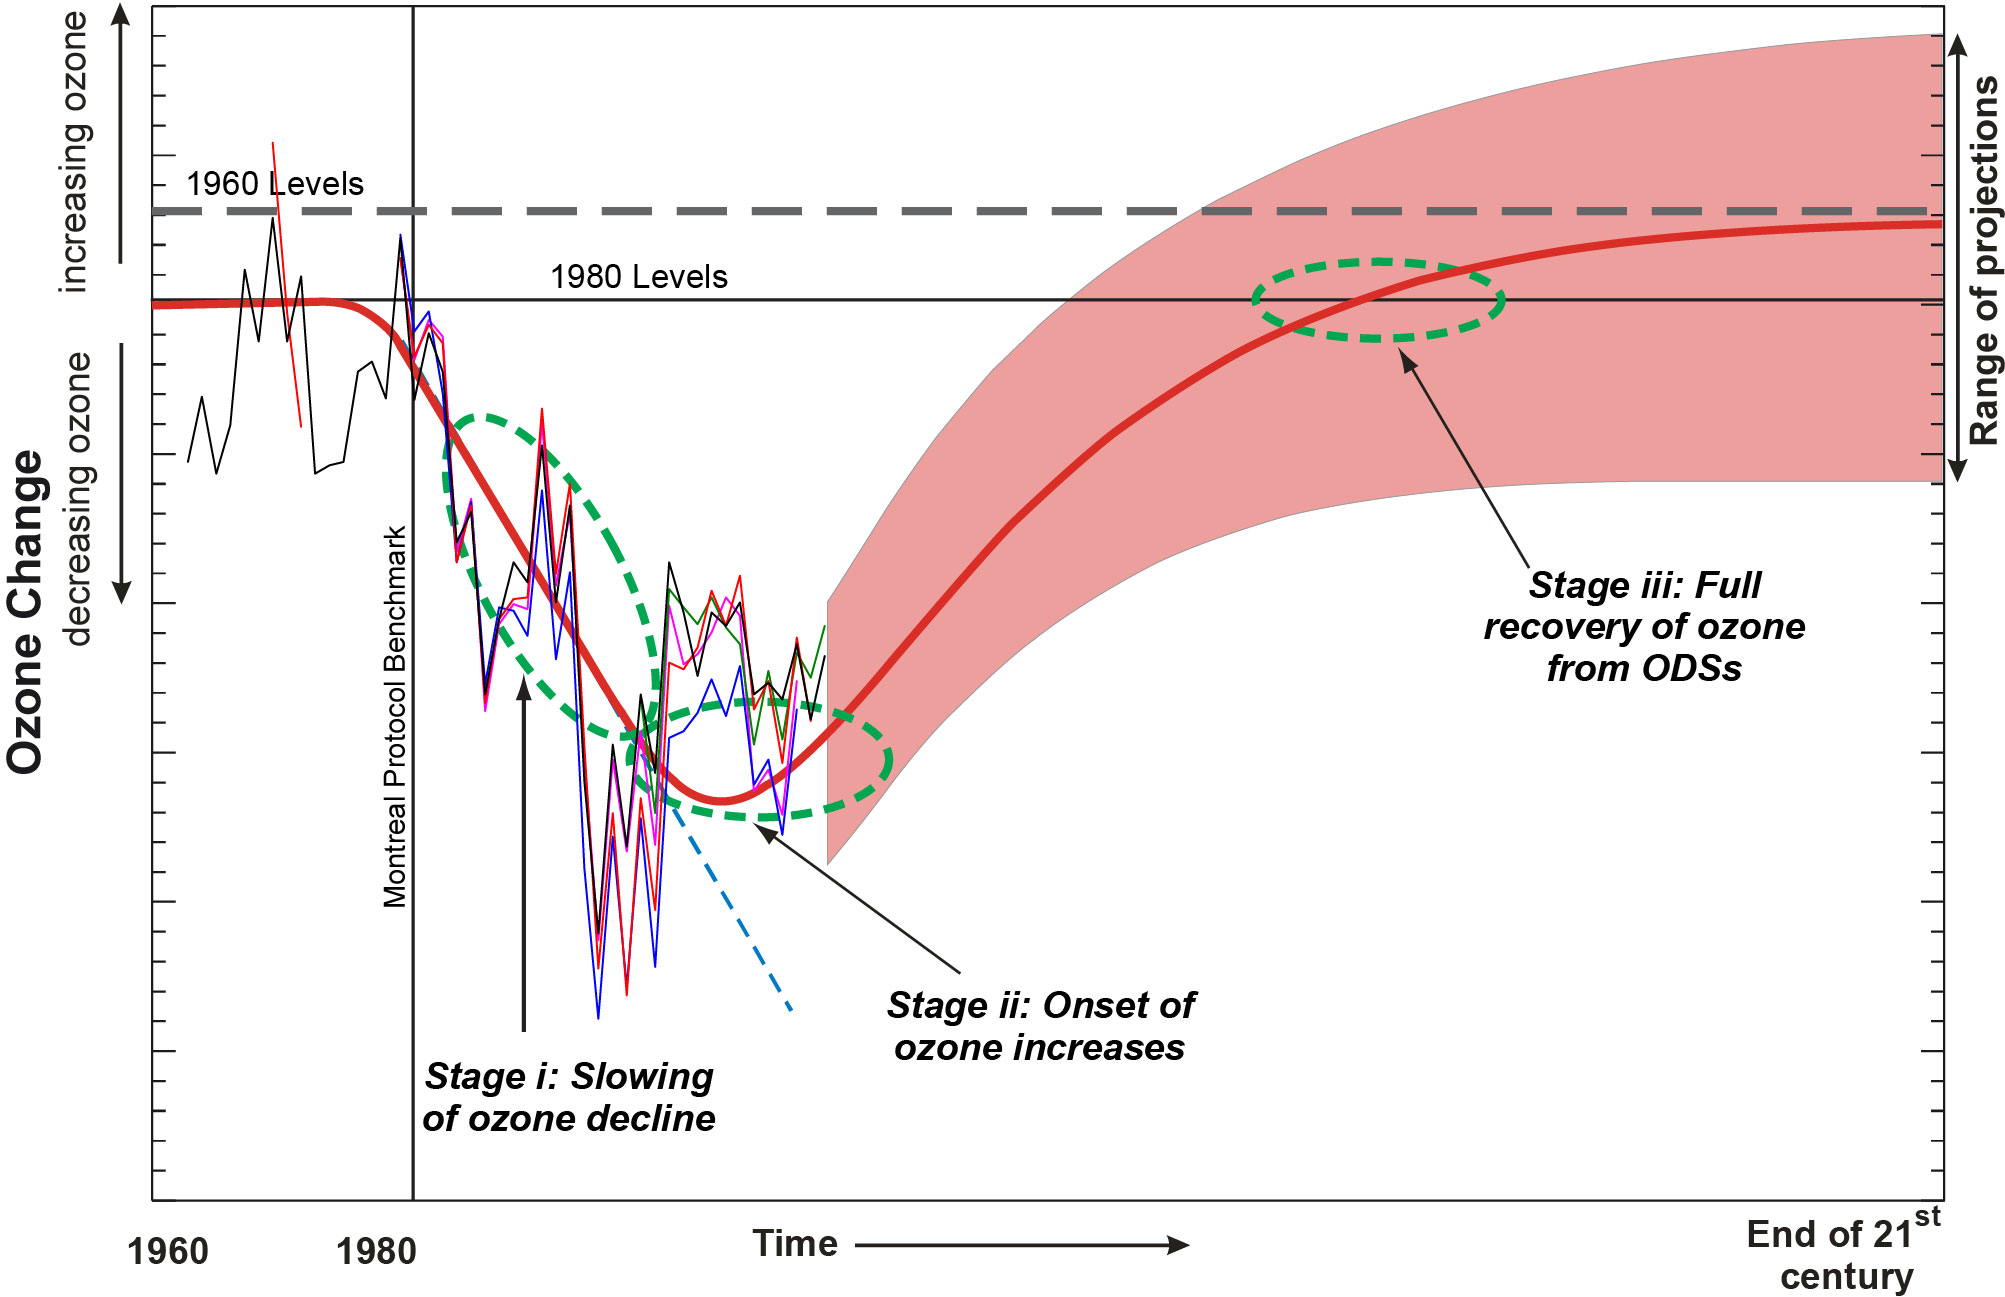
A conceptual diagram of the behavior of stratospheric ozone between 1960 and 2100 was presented in Chapter 6 of the 2006 Assessment (Bodeker and Waugh et al., 2007: "The Ozone Layer in the 21st Century"). A slightly modified version of this diagram is shown below.
As noted in the 2006 Assessment, stratospheric ozone abundances should change in response to decreases of ODSs and in response to other factors that influence ozone levels in the stratosphere. The other major factors are changes in temperature of the stratosphere because of increases in CO2, changes in transport associated with climate change, and changes in tropospheric composition.
The ODS increases in the past few decades depleted the ozone layer. In the future, as ODSs decrease, the atmosphere in general – and the stratosphere in particular – should have decreasing amounts of ozone-destroying halogen catalysts. This decrease will follow the emissions of ODSs but will be shifted to later times because ODSs generally have long atmospheric lifetimes.
The past and future timeline of ozone behavior has been categorized as: stage I – slowing of ozone decline; stage II – onset of ozone increases; and stage III – full recovery of ozone from ODSs. In this idealization it is assumed that ozone production is not altered significantly, and that the climate and tropospheric changes are sufficiently small that the influence of ODSs is the predominant factor that controls the rate of depletion of the ozone layer. Of course, because of natural interannual variability, the ozone abundances do not show sufficiently clear changes to allow precise identification of these timeline stages.

The observations are discussed in Chapter 2. The thick red line is a representation of the ozone amounts observed to date and projected for the future. The red-shaded region represents the model results predicted for the future. The Montreal Protocol 1980 ozone level benchmark is shown as the horizontal line. The dashed thick gray line represents the somewhat uncertain 1960 levels. The three recovery stages are shown by green dashed ellipses.
This three-stage timeline is a very useful conceptual picture for understanding ozone changes, diagnosing the current and future trends, and attempting to predict future ozone levels. However, as noted above, the ozone timeline is also influenced by other changes – climate change, volcanic eruptions that introduce sulfate aerosols in the stratosphere, and tropospheric composition changes. Further, the natural (and forced) variability in the Earth system will lead to difficulties in identifying as well as attributing these changes. These variabilities occur not only in the ozone abundances but also in the ODS levels, as climate change and other changes will alter when the ODS levels will reach values seen prior to 1980.
For all practical purposes, the Montreal Protocol has used 1980 levels as the time when there was little perturbation of the ozone layer by ODSs. This does not mean that there was no ozone depletion in 1980. Indeed, retroactive analyses of observations show that the ozone hole was growing prior to 1980. Yet we use 1980 levels of ODSs as the level when the ozone layer was not significantly influenced by ODSs and we will continue to use this date as a benchmark in this Assessment.
Because of factors other than ODSs, the ozone levels in the future could easily go above the values that were present either in the 1980s or even the 1960s. This situation was described in the previous Assessment as a "super-recovery." Of course, this is not recovery from the influence of ODSs but due to other factors, primarily CO2. Therefore, the use of the term "super-recovery" differs from references to recovery from ODS-forced ozone depletion.