A .gov website belongs to an official government organization in the United States.
A lock () or https:// means you've safely connected to the .gov website. Share sensitive information only on official, secure websites.


Download the high resolution Scientific Assessment of Ozone Depletion: 2010 cover image.
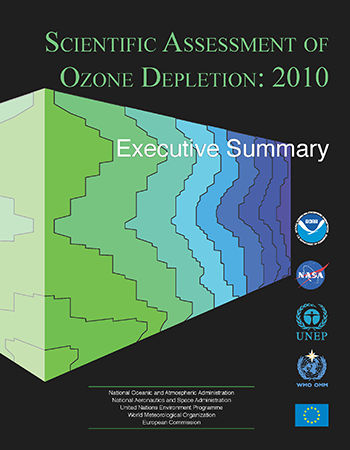
Artistic rendering of model results showing the dates for upper stratospheric ozone to return to various reference-year values between 1965 and 2000 (x-axis) as a function of latitude (y-axis). Contours are at 5-year intervals and show a range of earlier return dates (purples) to later return dates (greens). Taken from Figure 3-16 of Chapter 3 of Scientific Assessment of Ozone Depletion: 2010; figure originally published in Chapter 9 (J. Austin and J. Scinocca, Lead Authors) of the SPARC Report on the Evaluation of Chemistry-Climate Models (Stratospheric Processes And their Role in Climate), edited by V. Eyring, T.G. Shepherd, and D.W. Waugh, 2010. Cover design layout by Debra Dailey-Fisher, NOAA ESRL Chemical Sciences Division. Download the high resolution Executive Summary cover image.
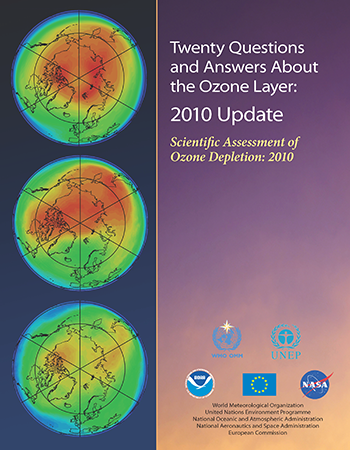
Satellite images of total ozone distributions in polar regions. The front cover shows the Arctic in the years 1971, 1980, and 2009 (see Q12 of this publication). The back cover shows the Antarctic in the years 1970, 1979, and 2009 (see Q11 of this publication). Cover design by Dennis Dickerson, Respond Grafiks. Technical Management and Contributions by Debra Dailey-Fisher, NOAA ESRL Chemical Sciences Division. Download the high resolution Twenty Questions and Answers About the Ozone Layer: 2010 Update cover image.