A .gov website belongs to an official government organization in the United States.
Secure .gov websites use HTTPS
A lock () or https:// means you've safely connected to the .gov website. Share sensitive information only on official, secure websites.
AiRMAPS Strategy
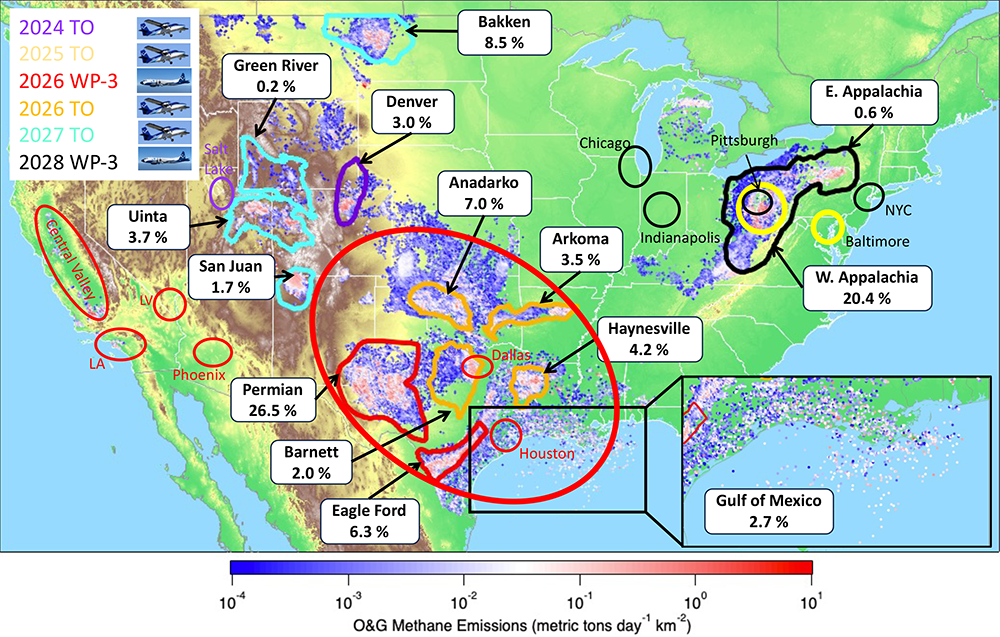
The OAR strategy for the airborne campaigns in 2024–2026 is shown in the figure below. The NOAA Twin Otter and NOAA WP-3D aircraft can be instrumented to measure greenhouse gases (methane, carbon dioxide) and other tracers (nitrogen oxides, carbon monoxide). The NOAA Twin Otter also measures wind velocities and boundary layer height with a Doppler lidar; a similar system is anticipated on the NOAA WP-3D by 2026. The enhanced NOAA WP-3D measurements also include co-emitted pollutants such as speciated volatile organic compounds (VOCs), oxidized nitrogen, speciated aerosol composition, etc.
2024 Colorado and Utah. OAR conducted a series of flights with a NOAA Twin Otter in Colorado's Denver-Julesburg Basin and Utah's Uinta Basin (oil and gas), and the urban areas of Denver, Colorado and Salt Lake City, Utah (a city with a long record of urban greenhouse gas measurements) with the airborne Doppler lidar, greenhouse gases and other tracer measurements. OAR also deployed ground based mobile platforms.
2025 Baltimore and Marcellus Shale. Washington, D.C. - Baltimore is a well-established urban greenhouse gas emission testbed that remains out of compliance with current standards for ozone pollution. The Marcellus shale is one of the largest U.S. oil and gas basins. OAR will survey both regions with a NOAA Twin Otter and ground based mobile platforms.
2026 Texas and New Mexico. From Houston, Texas OAR will deploy a NOAA WP-3D aircraft equipped with a state-of-the-art chemical payload designed to measure a comprehensive suite of trace gases, greenhouse gases, and meteorological parameters to investigate the evolving atmospheric landscape of Texas air quality.
This series of flights will survey several urban areas and a significant fraction of oil and gas production. The emissions estimates from the survey flights and coordinated activities will provide critical evaluation of top-down and bottom-up methods to reduce uncertainty and improve reliability. Coordination of these surveys with complementary methods from remote sensing and surface data will aid in assessing the accuracy of these approaches that provide longer-term monitoring of emission trends.
AiRMAPS airborne survey schedule for 2024-2026
The base map shows nitrogen dioxide columns as measured from the TROPOMI satellite instrument for summer 2023. The shaded areas and dashed circles show oil and gas (O&G) basins and urban areas for AIRMAPS surveys by year and aircraft (NOAA Twin Otter and NOAA WP-3D).