TexAQS 2006 TOPAZ Lidar data
August 14 - Final Data
| Previous Flight | Archive Calendar | Next Flight |
|---|
Flight #8
Takeoff: 13:24 CDT
Total flight time: 6.1 hours
Houston urban and ship-channel pollution was released into clean, southerly flow of 4 to 5 m/s, producing transport of the pollution plumes to the north. Sampling legs took place north of the city in approximately west-east flight legs. Data from the first leg, about 20 km north of the sources/urban area, distinguished two ozone and aerosol concentration maxima, one from the urban area of approx. 100 ppb, and the second from the ship channel industrial sources of approx. 120 ppb or more. Cross sections from the second leg showed two less distinct maxima as the plumes appeared to be merging, and the third and fourth legs farther north showed one wider plume, with peak concentrations exceeding 120 ppb. None of the high concentrations was observed in the surface ozone measurement network.
Select an image to view full resolution
Ozone Cross-section download ICARTT format data (ict file) download simple ASCII data (txt file) |
Aerosol Cross-section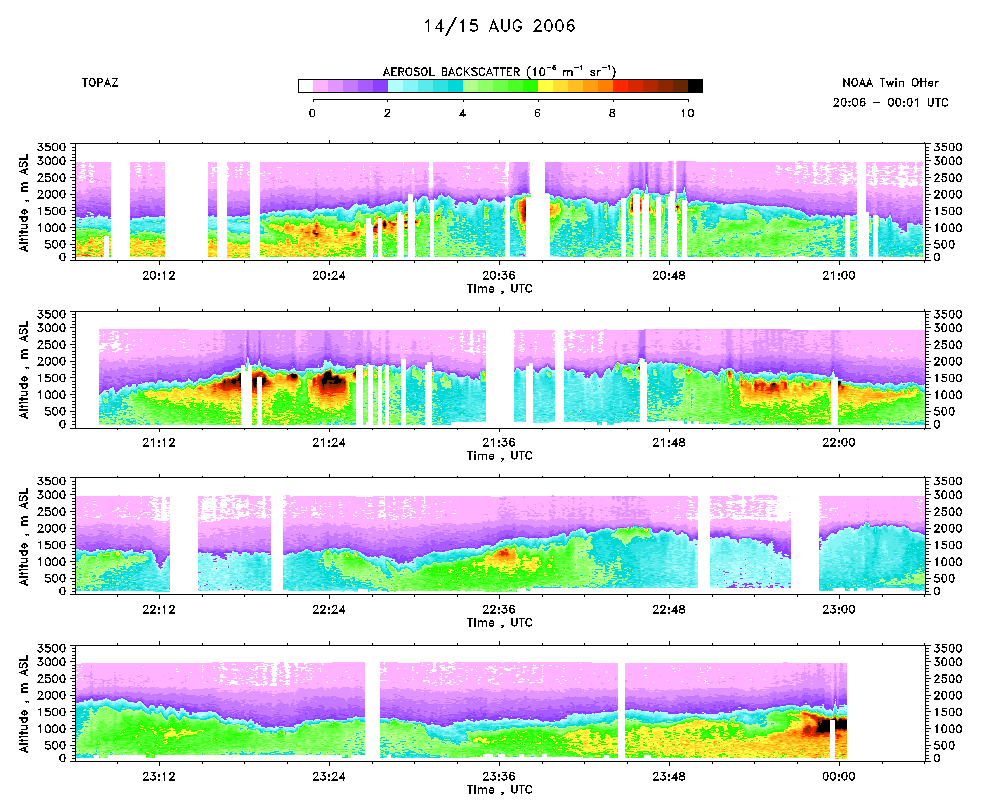 download ICARTT format data (ict file) download simple ASCII data (txt file) |
Ozone Map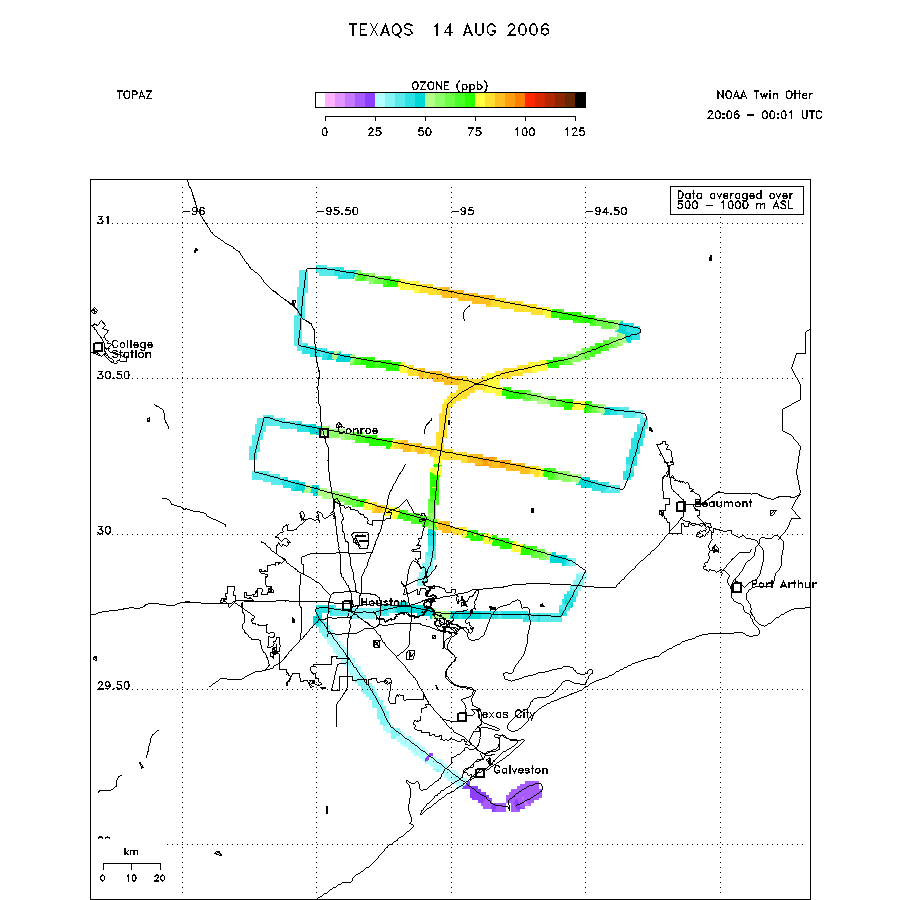 |
Mixed Layer Height Map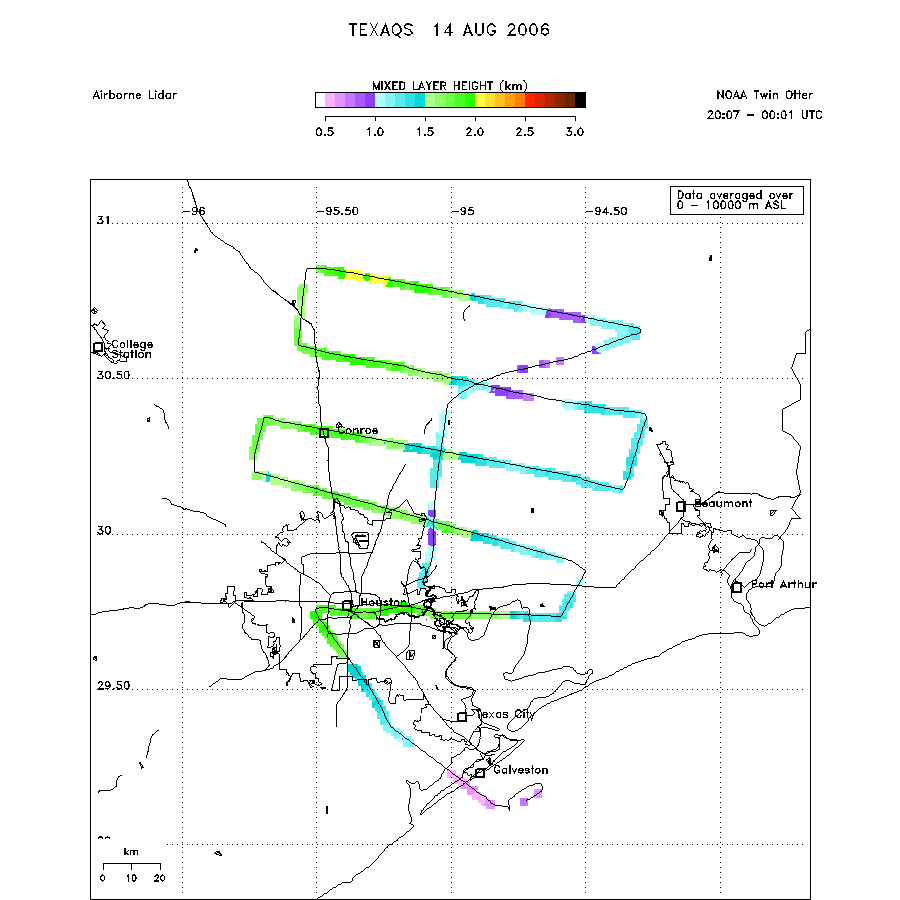 download ICARTT format data (ict file) download simple ASCII data (txt file) |