A .gov website belongs to an official government organization in the United States.
A lock () or https:// means you've safely connected to the .gov website. Share sensitive information only on official, secure websites.
18 December 2018

CSD scientist Dan Murphy co-authored an article recently published in the Proceedings of the National Academy of Sciences, focusing on cumulative radiative forcing (CRF).
Climate change is not only due to the contribution of greenhouse gases (GHGs) and aerosols at a moment in time; rather, historical levels of those species in the atmosphere also are important. One way to measure contributions to climate change is to add up the radiative forcing over a long period, which leads to the concept of cumulative radiative forcing (CRF). CRF can be calculated without a global climate model and can be used to apportion the global forcing of climate to the regions responsible for emissions of GHGs and aerosols.
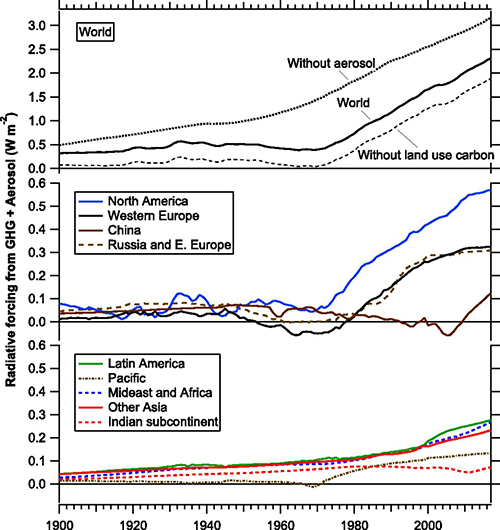
Murphy and co-author Ravishankara calculated the contributions of emissions from various regions to CRF. A number of patterns emerge from these calculations. First, several regions caused little CRF during periods of exponential emissions growth because of a temporary offset between GHG warming and aerosol cooling. That cancellation ends when aerosol emissions no longer grow exponentially, leading to a rapid increase in net CRF. That rapid increase started for North America in about 1970, Europe about 1980, and for China about 2010.
Second, concentrations of GHGs persist in the atmosphere for decades to centuries following their emission. That means that there is a commitment to future CRF from GHGs that have already been emitted. For every region, the commitment to future CRF exceeds the CRF to date.
Concentrations of GHGs persist in the atmosphere anywhere from 10-100 years following the initial emission. Aerosols, on the other hand, are short-lived and last only for weeks, so that their radiative influence is essentially simultaneous with their emission point. If all emissions ceased in 2017, global net radiative forcing would be larger than today for 15 to 20 years until GHG concentrations decayed enough to offset aerosol forcing.
Prior to Murphy and Ravishankara's study, other scientists had examined the contributions of various regions to GHG emissions. This new paper presents a simple method for making the calculation that includes the radiative forcing from both GHGs and aerosols.
Murphy and Ravishankara also compare CRF with other ways to measure the contributions of various regions to climate change. They conclude that contributions of various regions depend a lot more on future patterns of development than on whether CRF, ocean heat content, or temperature are used to measure the contributions from various regions.
Murphy, D.M., and A.R. Ravishankara, Trends and patterns in the contributions to cumulative radiative forcing from different regions of the world, Proceedings of the National Academy of Sciences, doi:10.1073/pnas.1813951115, 2018.
Different regions of the world have had different historical patterns of emissions of carbon dioxide, other greenhouse gases, and aerosols as well as different land-use changes. One can estimate the net cumulative contribution by each region to the global mean radiative forcing due to past greenhouse gas emissions, aerosol precursors, and carbon dioxide from land-use changes. Several patterns stand out from such calculations. Some regions have had a common historical pattern in which the short-term offsets between the radiative forcings from carbon dioxide and sulfate aerosols temporarily led to near-zero radiative forcing during periods of exponential emissions growth with few emission controls. This happened for North America and Europe in the mid-20th century and China in the 1990s and 2000s. However, these same periods lead to a commitment to future radiative forcing from the carbon dioxide and other greenhouse gases that stay in the atmosphere long after the aerosols. For every region, this commitment to future radiative forcing (2018–2100) from emissions already in the atmosphere is larger than the cumulative radiative forcing to date (1900–2017). This comparison again highlights how the full radiative forcing from greenhouse gases is unmasked once the aerosol emissions are reduced to improve air quality. The relative contributions from various regions to global climate forcing depends more on the time the contributions are compared (e.g., now or 2100) and future development scenarios than on whether cumulative radiative forcing, ocean heat content, or temperature is used to compare regional contributions.