Preliminary Findings
CO and Asian Transport
Carbon monoxide (CO) is a long-lived pollutant. On the WP-3D CO was measured as one second averages.
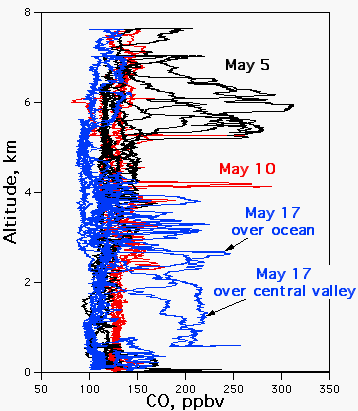
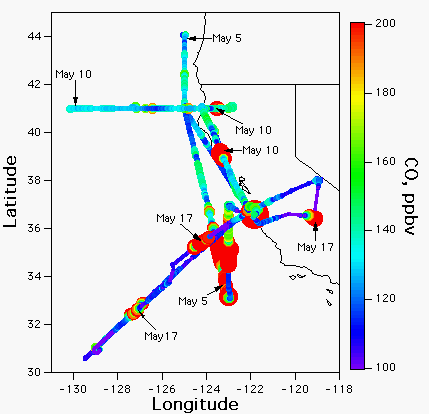
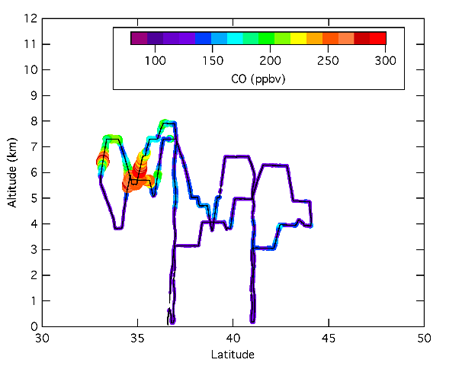
On three flights CO concentrations greater than 200 ppbv were seen in transport layers above 2 km. The graph below on the left shows the vertical profile of CO on these flights. The graph below on the right shows the flight track of the WP-3D on these flights, color coded and sized to CO concentrations. The units of CO are in parts per billion by volume (ppbv).
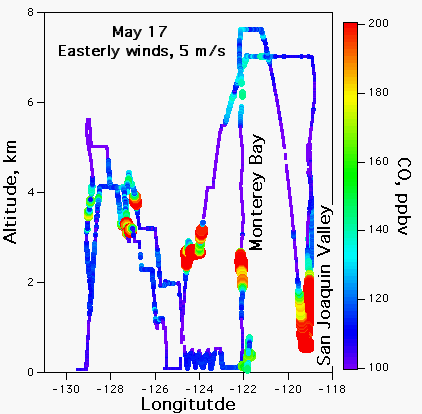
The transport layers can cover a large area and can slope up or down in elevation. The graph below shows an altitude versus longitude plot for the flight on May 17, 2002 sized and color coded to CO concentrations.
CO is an important tracer for anthropogenically influenced air masses.
The work of identification of sources and 'fingerprinting' of long range transport continues.
Ship Emissions
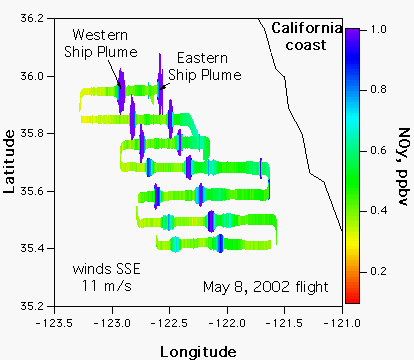
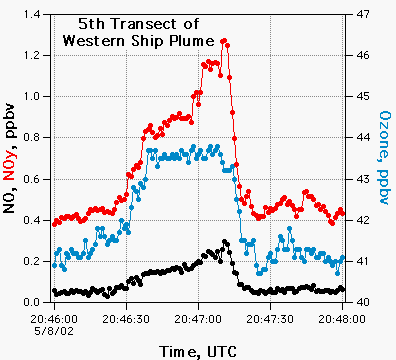
A portion of the May 8, 2002 WP-3D flight was devoted to making several downwind transects of ship emissions over the open ocean. Several ships were sighted; the WP-3D adjusted course to follow the plumes. For this portion of the flight, the aircraft maintained an altitude of 100 m. The graph below on the left shows the WP-3D track for this portion of the flight, color coded and sized for NOy concentration. The locations of the two plumes are easily distinguished from background levels and dilute with age. The graph below on the right shows a sample time series of NO, NOy, and O3 for a ship plume transect. An ozone enhancement of ~ 3 ppbv for this transect is identified.
Los Angeles Emissions
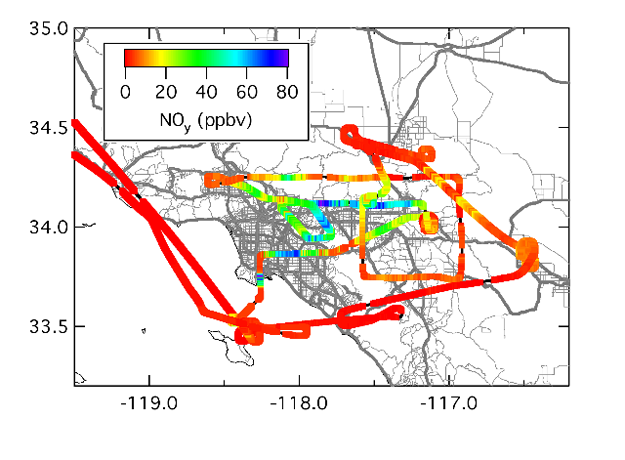
Metropolitan areas contain large emission sources. Tropospheric ozone is formed by the photochemical reactions involving volatile organic compounds and the oxides of nitrogen NO and NO2. NOy is the term used for the sum of all reactive nitrogen species (NO + NO2 + HNO3 + ...). The graph below shows the flight track of the WP-3D for the flight of May 13, 2002, color coded to NOy concentration levels. Very high levels of NOy, dominated by NOx (NO + NO2), can be seen within the urban region.
Forecasting Asian Transport
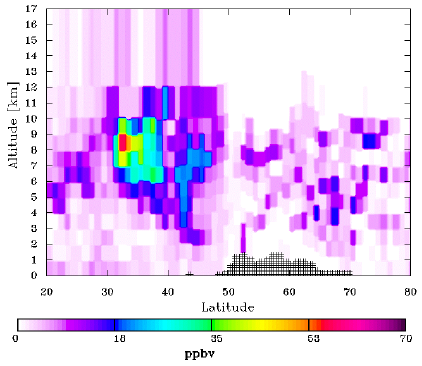
Comparisons between models and in situ data is a very important component of the ITCT 2002 project. The image below on the left is a FLEXPART forecast that was used by flight planners for the May 5, 2002 WP-3D flight. It predicted enhancements in CO over background levels in regions at -125 longitude.
The WP-3D flew in the vicinity of this predicted CO-enriched air mass and was able to obtain detailed structure of this interesting event. The image below on the right illustrates the track of the WP-3D, in an altitude versus latitude plot, color and size coded to total CO levels. The CO-enriched region predicted by model was confirmed. Note that the image below right is for WP-3D data at all longitudes (-125 to -122) on this flight.
The information contained herein is provided as a public service, with the understanding that the NOAA Aeronomy Laboratory and ITCT project collaborators make no warranties, either expressed or implied, concerning the accuracy, completeness, reliability, or suitability of the information. Permission for use of these data and additional information may be obtained from the investigating scientist or by contacting the data manager. Data is subject to change.