WP-3D Daily Summaries
7/25/04 WP-3D Flight Summary (Preliminary Observations) Updated 01/18/2005
Take off: 14:15 UTC, Landing 22:06 UTC, flight duration 7 h 51 min
A front passed the Eastern seaboard on 7/24 and turned stationary over the Atlantic, east of Nova Scotia, and was aligned in a NE to SW direction. The flow over the coastal areas of New England on 7/25 was from the NE.
The flight on 7/25 looked at the outflow of Sunday emissions from Boston and New York. The close-in transect SW of New York reflects the distribution of point and area sources in the NYC metropolitan area, with the western part showing high emissions of CO collocated with stronger emissions of SO2. The central part of the NYC plume has comparable CO concentrations, but significantly lower SO2 mixing ratios. At the eastern edge of the NYC plume the SO2 signature of a power plant on Long Island shows up. The measurements downwind of NYC should allow a good characterization of weekend emissions of gaseous species and aerosols from NYC.
One aim of the flight was the study of the chemical evolution of the plume from the Montour power plant in central Pennsylvania. The first downwind transect showed the plume to the NW of the power plant plume, which was characterized by high SO2 and aerosol concentrations. The NOy concentrations, however, were moderate due the use of SCR NOx scrubbers at he Montour plant. Unfortunately, the SO2 instrument malfunctioned after the first plume transect. The absence of the SO2 measurements and the low Noy concentrations made a further tracking of the plume during the flight difficult. Post flight analysis clearly shows additional plume crossings in the aerosol signal.
The Flexpart model had predicted accumulation of NYC and Philadelphia pollution over western Virginia and the flight indeed encountered elevated CO concentrations. As the area was covered by low-level clouds, part of the west to east transect from West Virginia in direction of Baltimore was conducted above a highly reflective clouds (Jno2>2E-2 s-1).
The acetonitrile measurements show widespread signature of biomass burning, with elevated layers apparent in several of the altitude profiles throughout the flight.
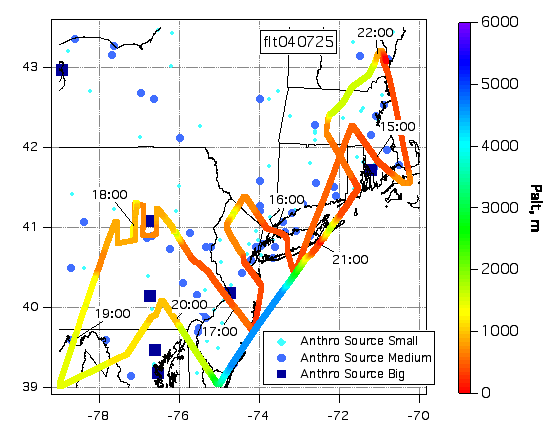
Actual Flight Track
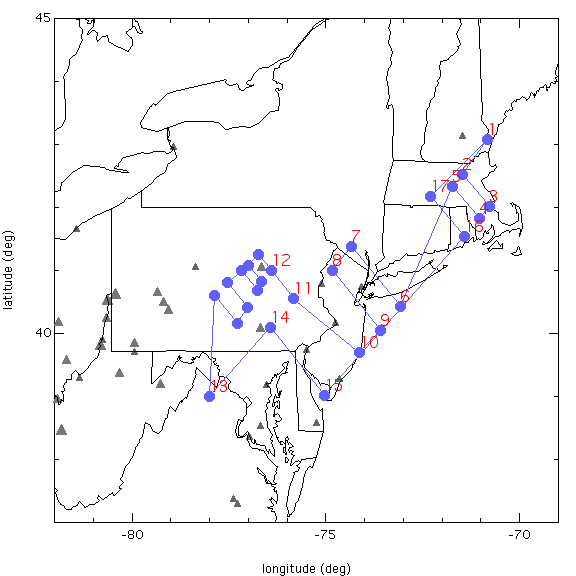
Flight Plan Map
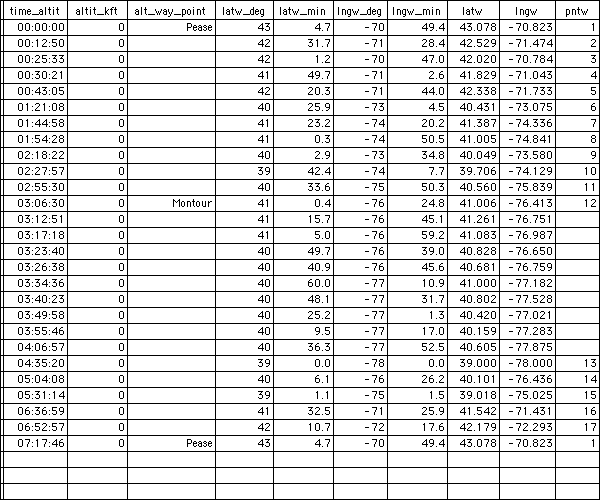
Flight Plan Lat/Lon Points