Urban air quality is no longer dominated by mobile sources
North American megacity VOC emissions, chemistry, and trends
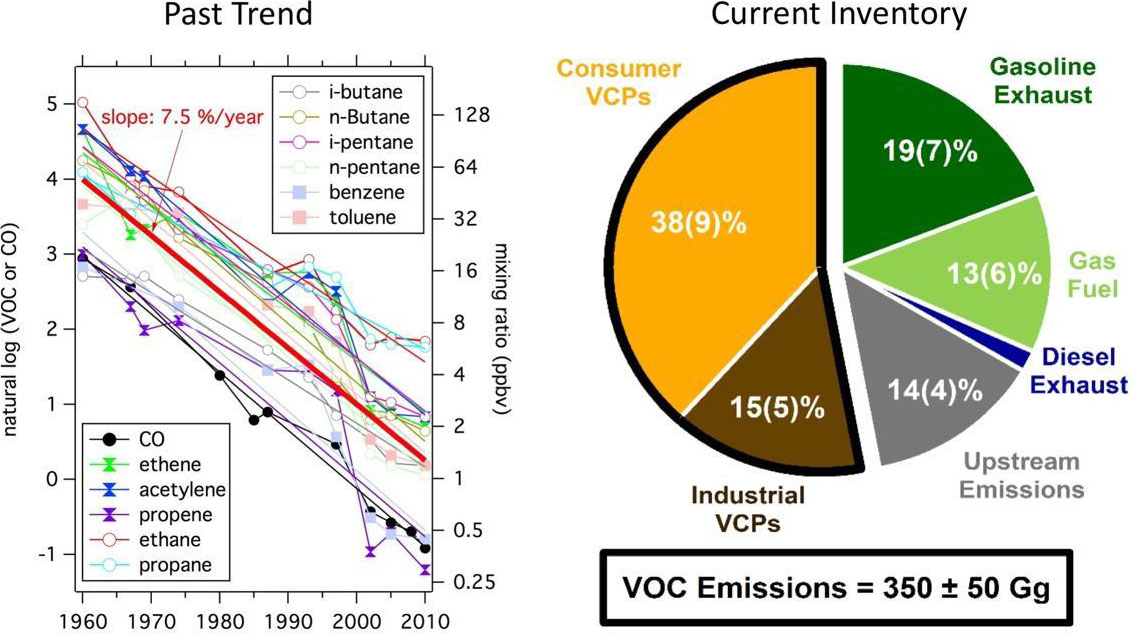
Volatile organic compounds (VOCs) emitted into the urban atmosphere are one of the needed ingredients for ozone and aerosol formation and therefore have the potential to impact air quality. For decades, fossil fuel usage has been considered to be the primary source of urban VOCs in megacities around the world, such as Los Angeles. As tighter emission regulations in the US and Europe have led to sharp reductions in transportation VOCs (Figure 1, Past Trend), new sources of pollution have emerged as potentially important precursors to ozone and aerosol formation. Research has shown that volatile chemical products (VCPs) are a major, under-studied source of urban VOCs that potentially play a significant role in urban air quality and human health. In industrialized cities, VCPs may make up as much as 50% of the total petrochemical VOC emissions and, consequently, could be responsible for as much as 50% of the mass associated with fossil-derived secondary organic aerosol (SOA) formation (Figure 1, Current Inventory).
Figure 1: (Past Trend) Trends in Los Angeles anthropogenic VOC emissions show sharp decreases in fossil-VOCs observed from 1960 to 2010. (Current Inventory) Future decreases in fossil-VOCs expected to be slower due to growing influence of VCP emissions.
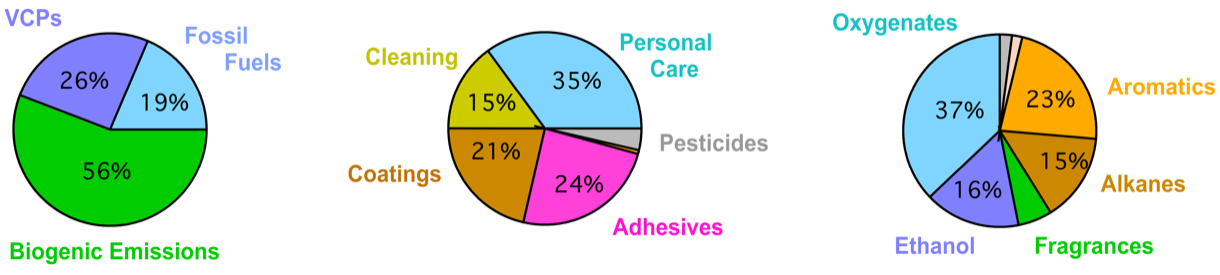
Unlike emissions from vehicles and energy production, VCPs are emitted from a wide range of human activities over a dispersed area. Quantifying the chemical fingerprint and emission strength is challenging. For instance, a significant fraction of VCPs likely originates from use in residential or commercial buildings, and emitted via building exhaust, though it is not well understood what fraction of VCP emissions could also occur outside or at waste facilities (e.g., landfills and wastewater treatment plants). These "indoor" VCPs, which include cleaning and personal care products, constitute approximately 50% of VCP emissions and are composed of oxygenated molecules that could form SOA efficiently. In addition to VCPs, there could be other indoor sources of VOCs from cooking and building materials that can contribute primary emissions of reactive aldehydes to the atmosphere.
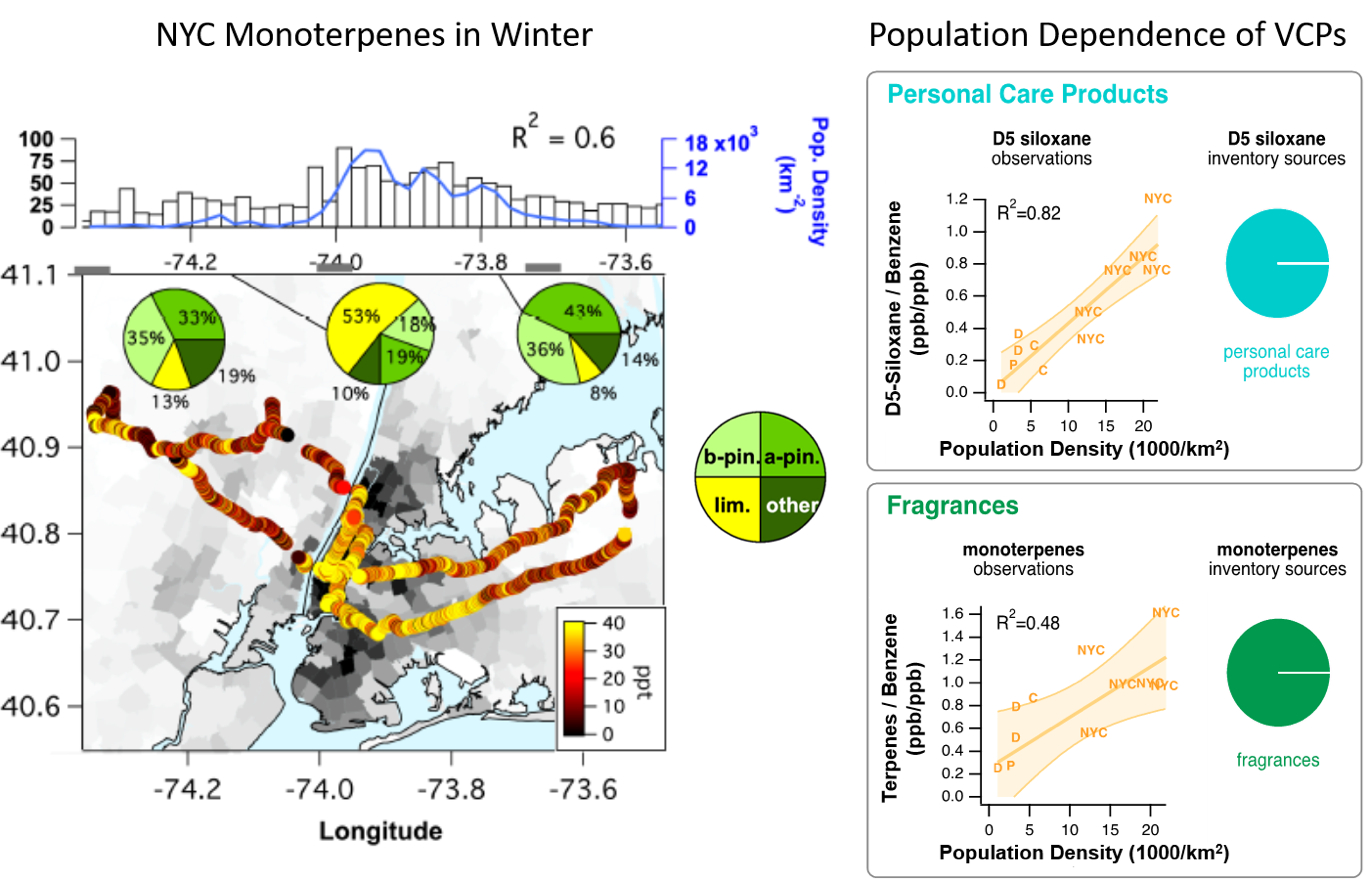
A recent pilot study in New York City and other major urban areas has shown that there is a clear signature of VCP emissions, such as D5-siloxanes from personal care products and anthropogenic monoterpenes from fragrances in personal care and cleaning products. VOCs such as monoterpenes from VCPs are efficient at producing ozone and SOA in an urban environment. D5 siloxanes and monoterpenes show the largest enhancements in the most densely populated areas around Manhattan and are well correlated with population density (Figure 2). Speciation measurements by GC-MS found that limonene, the most commonly used monoterpene in fragrances, was the dominant monoterpene isomer in downtown NYC during both winter and summer campaigns, compared to a- and b-pinene from biogenic emissions in New Jersey and Long Island. The monoterpene speciation, the high wintertime mixing ratios, and the correlation with population density clearly prove anthropogenic emissions of monoterpenes, particularly limonene.
Using New York City data, together with a bottom-up fuel-based inventory of vehicle emissions and volatile chemical products (FIVE-VCP) inventory, a study identifies tracer compounds for different VCP categories: decamethylcyclopentasiloxane (D5-siloxane) for personal care products, monoterpenes for fragrances, p-dichlorobenzene for insecticides, D4-siloxane for adhesives, para-chlorobenzotrifluoride (PCBTF) for solvent-based coatings, and Texanol for water-based coatings. Furthermore a follow up study did a source apportionment on the NYC and Boulder, CO data and showed that VCP-dominated emissions contributed to 42% and 78% of anthropogenic VOC emissions for Boulder and NYC, respectively, while mobile source emissions contributed 58% and 22%.
Elevated monoterpene emissions were also measured in other major U.S. cities (Chicago, Denver, and Pittsburgh). Figure 2 shows the ratios of D5 siloxane and monoterpenes to benzene (a marker for vehicle emissions) versus the population density for those cities, where NYC is separated into different areas of the NYC metro area. Emissions from VCPs (D5 siloxane and monoterpenes) are enhanced compared to traffic (benzene) with higher population density, as might be expected, because fewer miles are driven per person at higher population densities.
Figure 2: (NYC Monoterpenes in Winter) The drive track of the NOAA mobile laboratory color-coded with the sum of the monoterpenes measured with PTR-ToF-MS on top of the population density map of the New York City metropolitan area. The pie charts indicate the monoterpene composition determined by GC-MS. (Population Density Dependence of VCPs) The enhancements of D5-siloxane and monoterpenes relative to the traffic marker benzene for U.S. cities with different population densities.
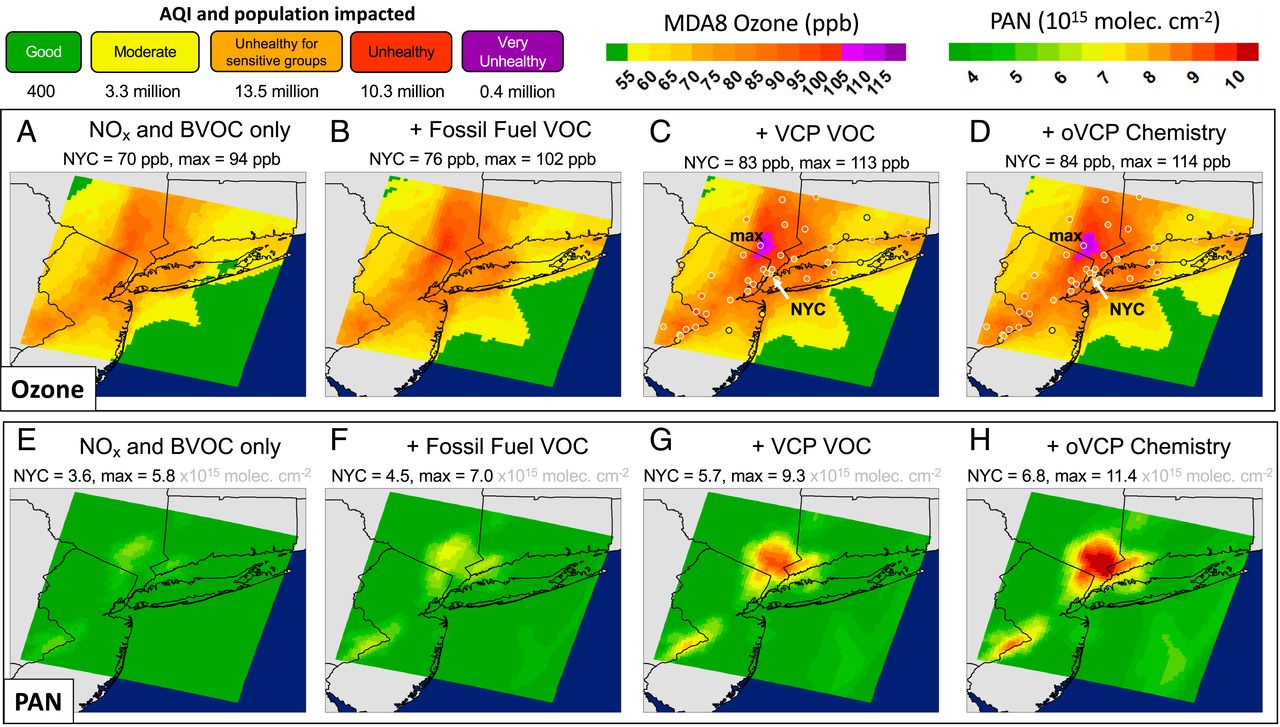
The VOCs emitted from VCPs play an important role in the production of ozone and SOA as can be seen from VOC data from a study in NYC during the LISTOS 2018 study. On July 2, 2018 an ozone exceedance event occurred in and downwind of NYC, arising from a major heatwave. Figure 3 shows results from the Weather Research Forecasting with Chemistry (WRF-Chem) model, simulating this ozone exceedance. The model shows that background ozone plus NOx and biogenic VOCs contribute ~80 ppb of 8-hour ozone to the urban corridor, which is enhanced by up to 30 ppb from the addition of anthropogenic VOCs, including from fossil fuel VOCs and VCPs. Ozone levels reached as high as ~120 ppb, which is well in exceedance of the 70 ppb 8-hour ozone standard, and ~25 million people were exposed to unhealthy air according to the US air quality index (AQI). The same ozone episode was used to initialize a box model simulation, which was used for a VOC sensitivity study. The box modeling found that fossil fuel VOC emissions are responsible for about 60% and VCPs for almost 40% of the anthropogenic ozone formation related to VOC emissions. The VCP fraction was about evenly split into coatings, cleaning products and personal care products. Ethanol and fragrances were two of the most important VOCs for ozone production during this exceedance event.
As fossil fuel VOC emissions decline and the importance of VCP emissions increase, VOC mixtures in urban regions are changing. Emissions from fossil fuels are largely hydrocarbons, which are well represented in traditional reduced chemical mechanisms, but VCPs include many oxygenated VOCs, which are not as well represented. Ozone simulations, when oVCPs are modeled with the inclusion of oVCP chemistry, show that this change in chemistry results in a small increase in ozone (1 ppb). Despite the marginal impact on the magnitude of ozone, the OH chemistry of oxygenates markedly impacts model simulations of other secondary products that have implications on downwind air quality. Oxidation of NOx occurs simultaneously with ozone production and leads to different compound classes that serve as either permanent sinks or temporary reservoirs of NOx. Two important NOx reservoir compounds are organic nitrates and peroxyacetyl nitrates (PAN), which have different atmospheric fates and therefore potentially different impacts on ozone formation downwind. The inclusion of oVCP chemistry increases PAN by 15 to 20% at the expense of organic nitrates.
Figure 3: WRF-Chem simulations of MDA8 ozone (parts per billion) and midday (2:00 PM local time) column integrated PAN (molecules cm−2) during the July 2, 2018, pollution episode. Shown are the simulations for global background + NOx and BVOCs (A and E), results from A and E with fossil fuel VOCs added (B and F), and results from B and F with VOCs from VCPs added (C and G). A–C and E–G show ozone and PAN produced under the assumption of hydrocarbon chemistry. D and H shows the simulation using full emissions but under the assumption of oVCP chemistry. Circles show the ozone mixing ratios measured at monitoring stations in the NYC area; those bolded in white exceeded US NAAQS. The numbers above each panel show the surface ozone or column PAN simulated in NYC and at the location of the MDA8 ozone maximum downwind of NYC (max). The pie charts show the ozone attribution by source, source category, and chemical class.
In addition to contributions to ozone, research suggested that VCPs can also contribute to SOA. A recent oxidation flow reactor (OFR) and high-resolution aerosol mass spectrometer (HR-AMS) experiment in New York City and Pittsburgh suggested there are significant SOA contributions from VCPs. The study compared the measured SOA from the OFR with predicted SOA formed from mobile sources and biogenics (Figure 4). The measured values were under-predicted by a factor of ~2 when compared with the observed values. The study further investigated what the missing source of urban SOA could be, and performed oxidation experiments on VCP emissions, which revealed that VCPs can efficiently form SOA. More recently, updates to emissions and SOA formation processes for VCPs in 3D atmospheric chemistry models reduced model biases for PM2.5 and SOA compared to observations from the CalNex 2010 field campaign and suggested that VCPs contribute to around 41% of the SOA during the summer in Los Angeles.
Figure 4: Measured and predicted SOA in urban and industrial environments at 2 equivalent days of OH exposure. SOA measured in the OFR is shown by the green bar and predicted SOA based on speciated VOC data by the pink tints. The predicted SOA only accounts for traditional gasoline, diesel and biogenic sources of precursors and under-predicts the observed values by a factor of ~2 in the morning time street canyon and suggests the influence of VCPs on SOA.
Additionally, during the COVID-19 pandemic, government and societal interventions led to large changes in atmospheric emissions including reductions of transportation emissions of NOx and VOCs. Similar reductions in emissions are expected to occur in the future as electrification of motor vehicles increases. While the impact of these COVID-19 interventions on NOx is clear, the impact on VOCs remains understudied. Given VOCs large impact on urban air quality through ozone and SOA production, more current measurements with state-of-the-art VOC speciation capabilities are needed to understand how VOC concentration and composition has changed over the last decade in order to improve predictions of air quality now and in the future.
These measurement and modeling studies indicate the importance of VCPs, in addition to traditional fossil fuel sources, for ozone and SOA and clearly demonstrate the need for understanding their chemistry in the urban environment and taking VCPs into account in air quality management.
North American megacity NOx emissions, chemistry, and trends
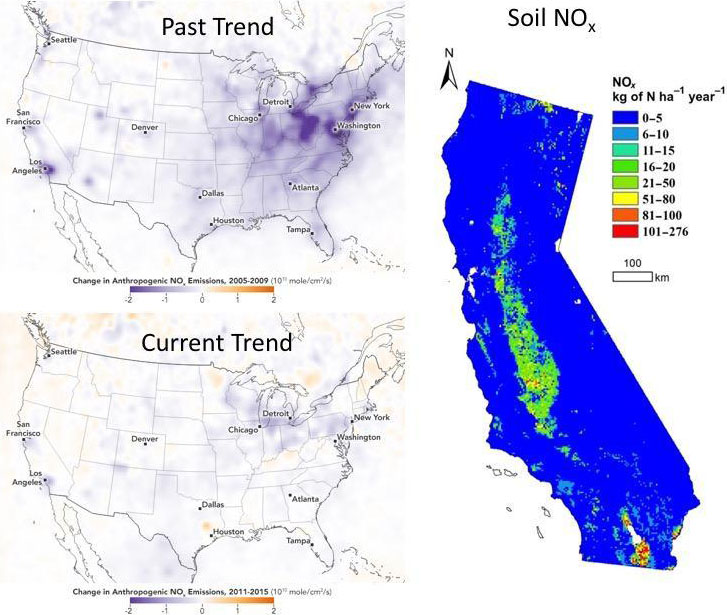
Nitrogen oxides (NOx = NO + NO2) are the second needed ingredient for ozone and secondary aerosol formation. NOx emissions have been decreasing since 1960 for example in Los Angeles at a rate of about 2.6% per year. Similar rates of decrease in NO2 mixing ratios are observed nationwide, but satellite retrievals of NO2 columns from the Ozone Monitoring Instrument (OMI) indicate a markedly slower rate of decrease since 2011 (Figure 5, left panel). A variety of hypotheses have been suggested on why this trend is slowing, including: (i) a decrease in the rate of decline in anthropogenic NOx emissions, (ii) the growing influence of background and free tropospheric NO2, and (iii) changes in NOx lifetime.
A recent study suggested that agricultural soils are a dominant source of NOx pollution in California, with especially high soil NOx emissions from the state's Central Valley region (Figure 5, right panel). This large, overlooked NOx source from cropland soil could increase the NOx budget by 20 to 51%. Fertilizer application also results in nitrous oxide (N2O) emissions, a potent greenhouse gas, and emissions are strongest in the Midwestern corn/soy belt and in spring/early summer). It is possible that the increasing importance of soil NOx emissions could be contributing to the slowdown observed in satellite NO2 columns shown in Figure 5, and consistent with NOAA CSL modeling of ozone over the Eastern US, which also suggested an under-accounted soil NOx source in the Upper Midwest.
In addition to uncertain trends, recent studies have also suggested significant uncertainties in current vehicle emission models of mobile source NOx based on a variety of field campaigns. It is critical to improve inventories of NOx for accurate model predictions of ozone and aerosol chemistry. With the launch of the Sentinel-5P Tropospheric Ozone Monitoring Instrument (TROPOMI) and enhanced spatial resolution of its satellite products (3.5 km x 7 km), satellite NO2 and formaldehyde data are becoming an increasingly useful tool for evaluating and constraining emission inventories, including of NOx and VOCs. Satellite capabilities are expected to increase with the anticipated launch of the geostationary Tropospheric Emissions: Monitoring Pollution (TEMPO) satellite in 2022.
Figure 5: Trends in US NOx emissions derived from OMI satellite products and utilizing an inverse modeling framework. NOx emissions are decreasing from 2005-2009 (Past Trend) but decreases are slowing down from 2011-2015 (Current Trend). (Soil NOx) NOx emissions from California soils (natural and cropland) generated using stable isotopic modeling and IMAGE model.
North American tropospheric ozone formation and trends
Overall, summertime levels of surface ozone have been trending downward from 2000-2014 together with its precursors as described above. In the southeast US, it was shown recently that ozone maxima decreased in proportion with NOx emissions. Prior to the 2008 recession, large emission reductions have been observed from space due to U.S. regulatory efforts to control NOx from power plants and transportation.
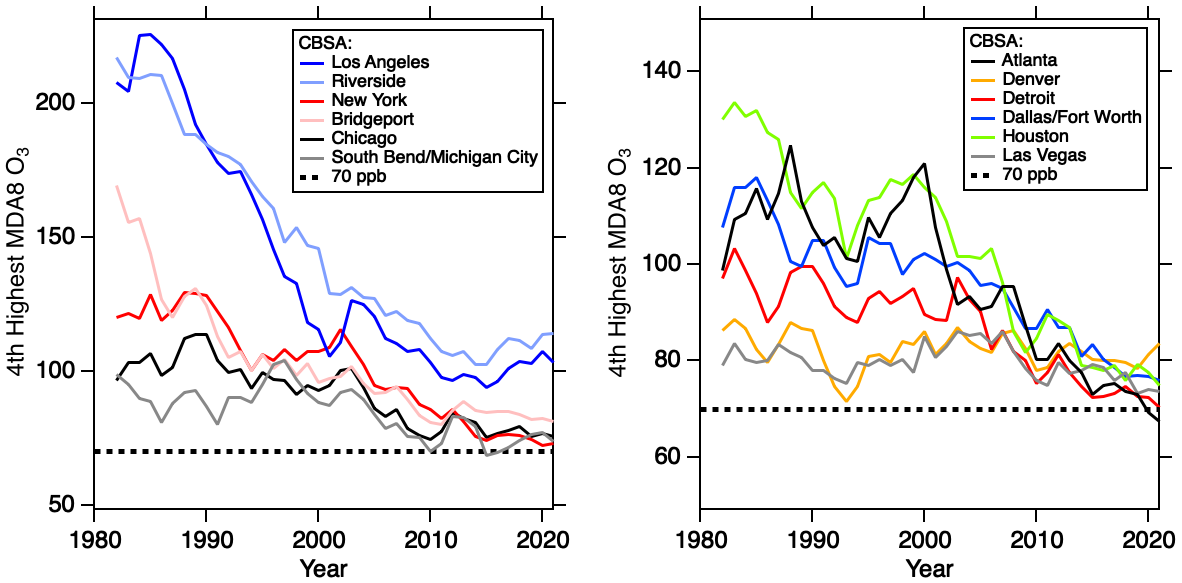
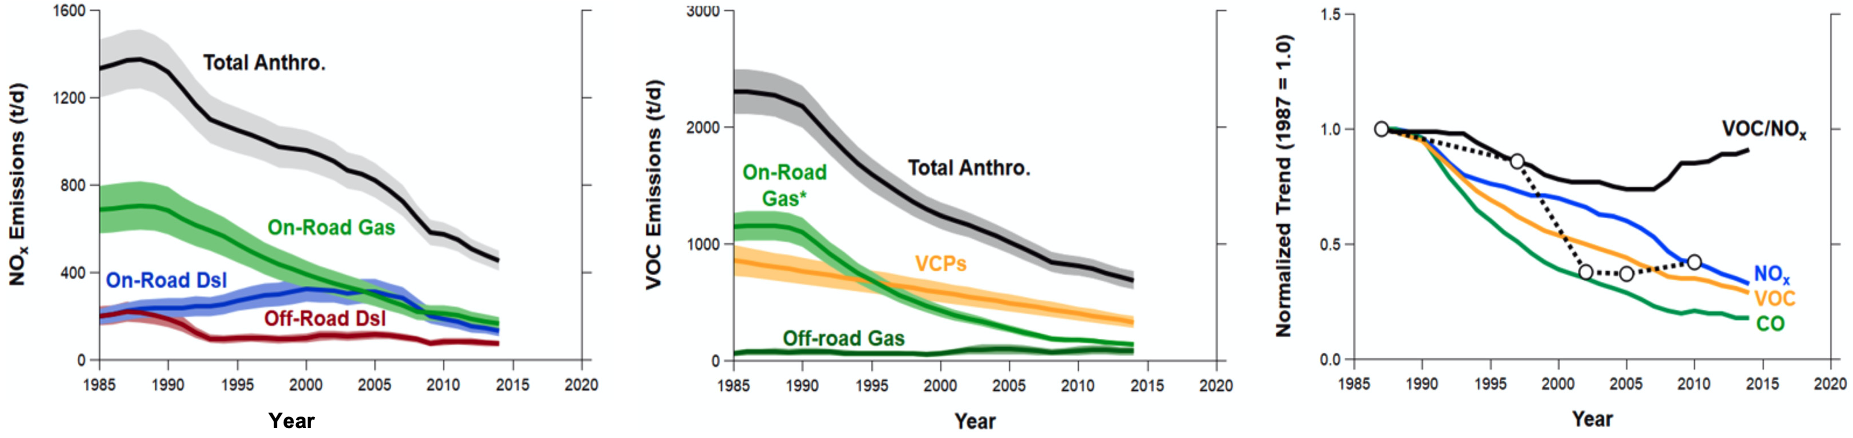
The ozone trends since 1980 in the major target cities for AEROMMA are shown in Figure 6. Plotted are the 4th highest annual maximum of the MDA8 ozone values of the Core Based Statistical Areas (CBSAs) in Los Angeles, NYC, and Chicago together with their respective downwind CBSAs and trends in other U.S cities that might be AEROMMA targets. In the most recent years, the downward trend has slowed down significantly, especially in Los Angeles, NYC, and Chicago. The trends of NOx and VOCs emissions from the FIVE emission inventory in Los Angeles are shown in the bottom panel of Figure 6. NOx emissions have been decreasing linearly over the past thirty years, while VOCs showed a slower decrease over the past twenty years mainly driven by the VCP sector. These trends caused the VOC/NOx ratio to increase over the past decade. Research concluded that the Los Angeles basin is undergoing a significant transition in photochemistry toward a lower ozone concentrations, but the lack of recent progress in O3 design value is a subject of intense current research.
Figure 6: Trends in the 4th highest annual maximum of the MDA8 ozone in the AEROMMA target cities and their downwind areas since 1980. (bottom) Trends of the FIVE‐VCP NOx and VOC) total and sectoral emissions (ton day−1, t/d) in the Los Angeles Basin from 1987 to 2014. Trends of the FIVE‐VCP emissions normalized to the values in 1987 for NOx, VOC, CO and VOC/NOx. The top‐down model adjusted VOC/NOx emissions trend is shown by the dashed black line and open markers denote model years simulated in WRF‐Chem.
Aerosol formation and trends
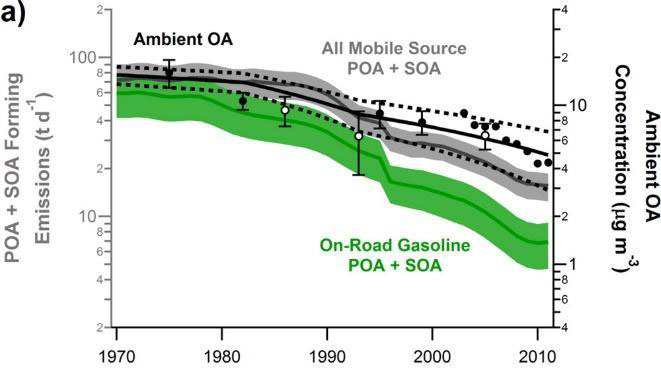
Nationally, organic aerosol (OA) comprises around half of the fine particulate matter (PM2.5) mass, and US concentrations have been decreasing since 1990. Research attribute the decreases in atmospheric concentrations of OA to reductions in transportation and residential fuel burning emissions, including directly emitted particles and VOC precursors (Figure 7). Similarly, research found that OA concentrations were decreasing in Los Angeles due to reductions in tailpipe emissions of primary and secondary OA (Figure 7), although the decreases were not as large as expected from the observed reductions in mobile source emissions. The study suggested that other VOC sources could be contributing to the slower-than-expected decreases in OA concentrations. Research later found that the slow OA decrease is likely due to a shift away from the dominance of mobile sources.
Figure 7: Trends in organic aerosol concentrations in the Los Angeles basin and in the U.S. from GEOS-Chem and IMPROVE sites. Decreases are attributed to reductions in motor vehicle emissions and other sources of SOA.
Additionally, ammonium nitrate accounted for around ~1/3 of the summertime submicron PM in Los Angeles during CalNex 2010. Heavy-duty diesel trucks have become the leading source of NOx in the Los Angeles basin, and in cities over the Eastern US. Starting in 2010, new heavy-duty diesel trucks are required to install selective catalytic reduction (SCR) systems. Under highway driving conditions, the SCR systems are effective at reducing NOx emissions. However, under urban driving, the SCR systems are ineffective and result in significantly elevated emissions of NOx. The reagent used to reduce NOx within the SCR is urea, and if slippage occurs, could also result in a local urban source of ammonia (NH3).
Greenhouse gases and air quality co-benefits
Globally, cities account for ~50% of the world population and at least 70% of the CO2 emissions. Yet a robust urban carbon monitoring system for CO2 and CH4 has not been established to track trends in greenhouse gas emissions, though urban testbeds have been established in Indianapolis (INFLUX), Los Angeles (Megacities Carbon Project), and Baltimore/Washington, DC (Northeast Corridor Urban Test Bed) with support from NIST.
In most US cities, buildings and transportation comprise the two largest sources of CO2 emissions. These sources also are the two main NOx sources in cities and of VOCs to the urban atmosphere contributing to ozone and PM2.5. Fugitive leaks of methane have been shown to occur from the oil and natural gas production and supply infrastructure and landfills. Refineries remain an important source of reactive VOCs and oil and natural gas infrastructure are a source of light alkanes. Relatively little attention has been paid to VOC emissions from landfills, though they could be a potential emission pathway by which VCPs are emitted into the atmosphere. Given the overlap in emission sources that contribute to both air pollutants and greenhouse gases, there are potential synergies for cities to optimize management of air quality and the carbon cycle.
The role of heatwaves, meteorology, and long-range transport on urban air quality
Over the last 50-60 years, US heatwaves have become more frequent, last longer, and are more intense. Heatwaves have been associated with enhanced levels of ozone, as well as human mortality. As Figure 3 illustrates for New York City, heatwaves can significantly enhance ozone well in exceedance of national ambient air quality standards. However, the impacts of meteorology on ozone and aerosol formation are complex through dependencies on temperature, sunlight, precipitation, and effects on dynamical and physical processes. For example, warmer temperatures are expected to result in a higher planetary boundary layer which enhances dilution and lowers air pollutant concentrations. This can be offset if a heatwave results in stagnant wind conditions and/or recirculation of air masses that allow for build-up of air pollution.
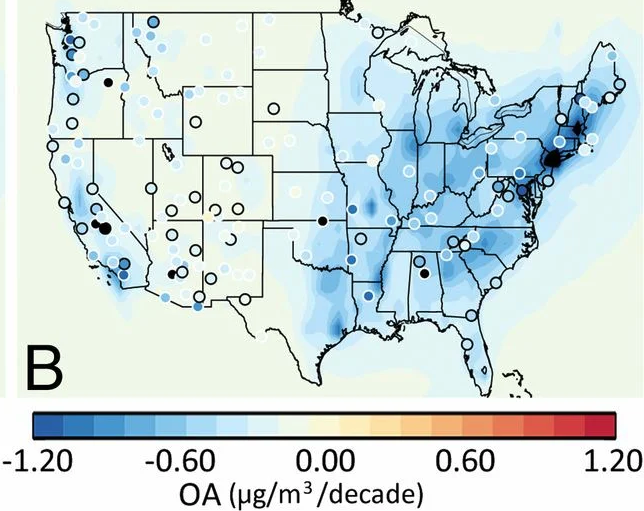
It is well established from prior NOAA CSL field campaigns that coastal dynamics affect the transport of ozone and other air pollutants, including during NEAQS 2002, ICARTT 2004, TEXAQS 2000, TEXAQS 2006, and CALNEX 2010. As Figure 8 illustrates, chemical transport modeling from ICARTT 2004 shows that ozone can be transported from Washington, DC through New York City up to the Gulf of Maine, which is driven by mesoscale meteorology along the coast. There is a lack of high-quality wind profiler and thermodynamic measurements over water surfaces, which inhibits evaluation of numerical weather prediction models. Ship or airborne lidars fill a critical measurement gap in providing data that can improve models of the marine boundary layer, land-sea breeze recirculation, vertical mixing, as well as characterizing offshore wind energy resources.
Figure 8. Transport of ozone (in ppb) as modeled in WRF-Chem along the US East Coast, from the Mid-Atlantic through the Gulf of Maine, during the ICARTT 2004 field campaign.
In addition to coastal dynamics, urbanization results in the modification of land surfaces that alter the surface energy balance. Urban heat islands (UHI) result when asphalt or concrete with low albedo replace soils and vegetation and inhibit evapotranspiration. The magnitude of UHI can be modeled as a function of population and precipitation, with the effect stronger in the most populated cities. Accounting for the urban canopy in chemical transport models was shown to improve model predictions of ozone in New York City during the ICARTT 2004 field campaign. Using high-resolution vegetation maps and albedo maps was shown to improve the WRF model performance of urban meteorology in Los Angeles. The effects of urbanization are an additional factor to consider on meteorology in coastal cities. A key question is to what extent does the urban canopy need to be parameterized and represented in chemical transport models? Often the urban canopy is overlooked in operational weather forecasts due to computational cost.
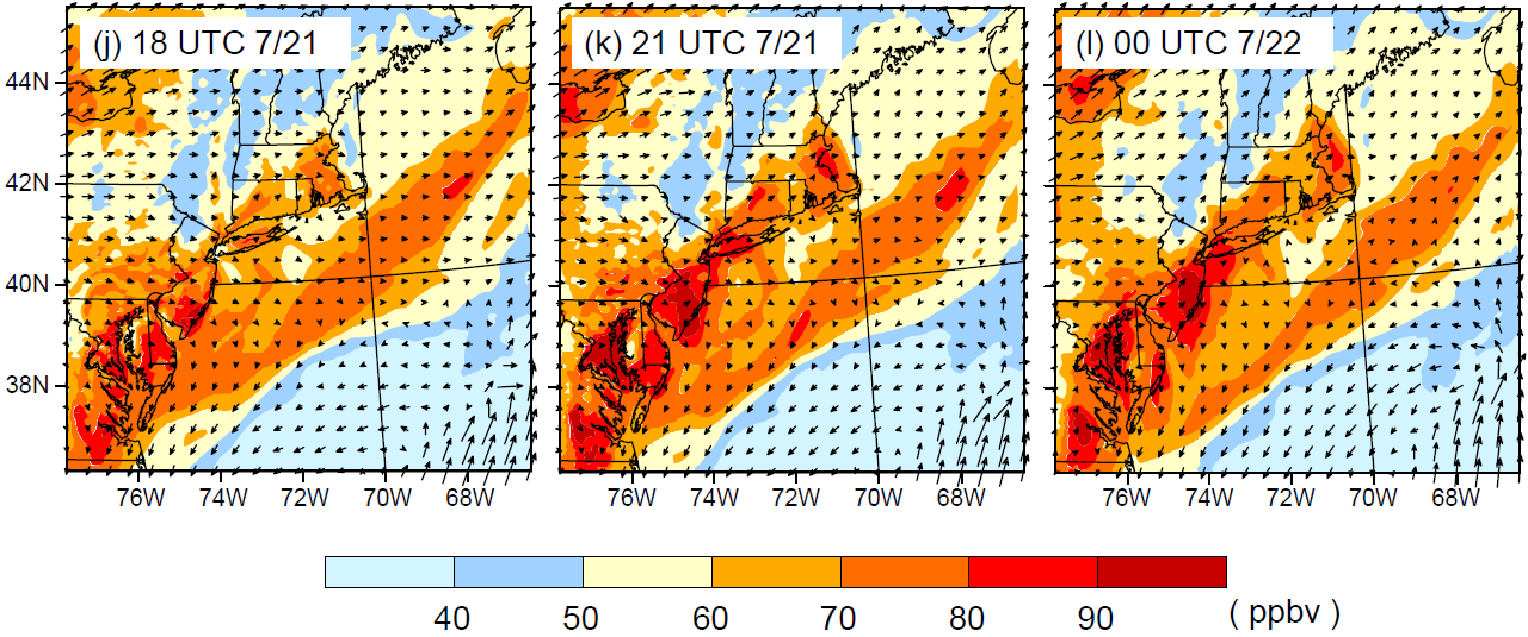
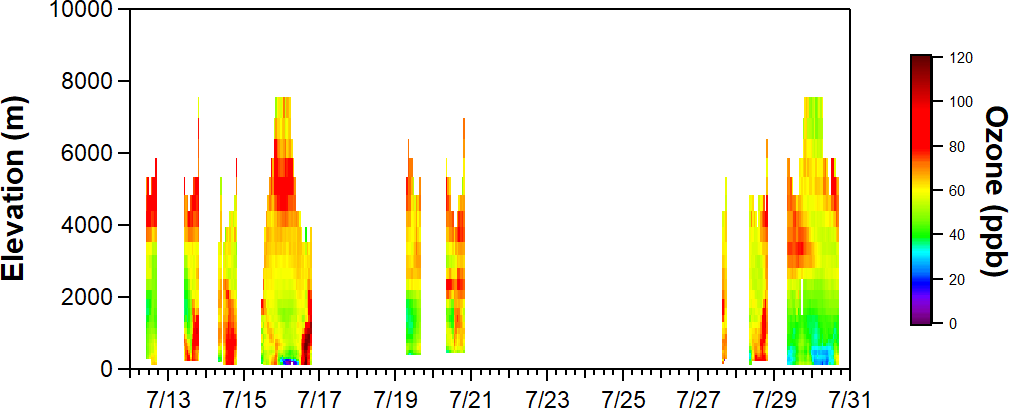
Ozone and aerosols can be transported on regional to continental scales. Global contributions to background ozone are estimated to be ~30 ppb over the Eastern US and have a higher contribution in the Western US of ~40 ppb at high-altitude sites. With the lowering of the 8-hour US ozone standard to 70 ppb, and generally increasing trends of global background ozone, it is becoming more challenging for cities to meet national ambient air quality standards. Additionally, ozone can also be transported from the stratosphere to the troposphere, especially in the intermountain west. Terrain can result in lofting of air pollution from Los Angeles, which lowers concentrations in Los Angeles and elevates pollutants transported over long distances to other states. Ozone and aerosol lidars that report vertically-resolved concentrations can be helpful in discerning local versus long-range transport of air pollution, as well as whether there is mixing from the free troposphere to the surface. Figure 9 shows an example of ozone lidar measurements made by the NASA Langley mobile ozone lidar (LMOL) located downwind of New York City during LISTOS 2018. While high ozone levels at the surface are generally decoupled from the free troposphere, there are instances where downward transport of ozone to the surface is evident. Similarly, for aerosols, wildfire smoke from Alberta, Canada has been shown to transport over North America and contribute to increased surface PM2.5 by 5-30 μg/m3 in New York City. The vertical mixing and transport between the stratosphere, free troposphere, and planetary boundary layer is an additional consideration on coastal meteorology that can affect urban air quality.
Figure 9: Example of ozone lidar measurements by NASA Langley during LISTOS 2018 at Westport, CT.
Role of observations for evaluating and improving research, regulatory, and operational 3D atmospheric chemistry models
Past ground site, mobile, and aircraft campaigns with comprehensive measurements of gases and aerosols have been critical for evaluating and improving model processes and prediction of air pollutants in 3D atmospheric chemistry models. For example, observations from CalNex 2010 and LISTOS 2018 have motivated an update of emissions and chemistry from VCPs leading to improved predictions of ozone and SOA. Aircraft campaigns are particularly important for evaluating model processes because unlike routine groundsite monitoring, which only measure a small number of gases and aerosols like ozone and PM2.5, aircraft campaigns provide co-located detailed high-quality chemical measurements including ozone precursors (e.g., VOCs and NOx) and speciated aerosols. Additionally, aircraft campaigns provide broader spatial and vertical coverage than routine groundsite monitors. This greater chemical, spatial, and vertical detail in aircraft observations is important for accurately identifying the cause of model biases and for evaluating potential model improvements.
Current measurements of ozone, aerosols, VOCs, and NOx with broad spatial and vertical coverage over urban regions are needed to understand how air quality has changed over the last decades and evaluate if research, regulatory, and operational models are accurately reflecting these changes. Studies suggest that anthropogenic emissions are changing more rapidly than can be reflected in traditional inventories such as the US EPA National Emissions Inventory, especially for exceptional events such as the 2008 Global Economic Recession and the COVID-19 pandemic. More up-to-date detailed chemical measurements in urban regions are needed for creating and evaluating new approaches that allow for emission inventories to be updated in near real time, which is particularly important for improving air quality predictions in NOAA operational models. Additionally, more measurements of VOCs with a wider range of volatilities are needed in urban regions for developing and evaluating new chemical mechanisms such as CRACMM (Community Regional Atmospheric Chemistry Multiphase Mechanism). CRACMM will reflect the changing VOC distribution in urban regions (e.g., reduced contribution of hydrocarbons from fossil fuels and increased contribution of oxygenated VOCs from VCPs), include scientific advances such as autoxidation and improved representation of heterogeneous processes, and be reduced enough to be considered for regulatory and operational applications. In addition, a new model diagnostic tool called MELODIES MONET is under development to encourage more complete evaluation of research, regulatory, and operational models against a variety of surface, aircraft, and satellite observations all within the same framework. A more rigorous and accurate understanding of model biases covering chemical, spatial, vertical, and temporal scales can be achieved by evaluating models against a combination of different types of observations, of which aircraft campaign measurements are an important component for providing detailed chemical, spatial, and vertical resolution.
Recent advances in understanding of the remote marine atmosphere
Biogenic sulfur oxidation
Biogenic emissions of sulfur from Earth's oceans are well known to influence global climate, but potential feedbacks affecting radiative budgets have been an ongoing topic of debate. Dimethyl sulfide (DMS), the most abundant biological source of sulfur to the marine atmosphere, is central to this research. DMS oxidation is the source of up to 18% of the global sulfate burden in the present-day atmosphere with an approximate burden in the preindustrial background of over 48%. Understanding the importance of DMS derived sulfate relative to other marine aerosol sources such as sea-spray aerosol, long-range transport of terrestrial particles, and secondary marine aerosol produced from non-DMS precursors, in both pre-industrial and present-day atmospheres, requires a complete understanding of the chemical and physical processes affecting DMS oxidation products.
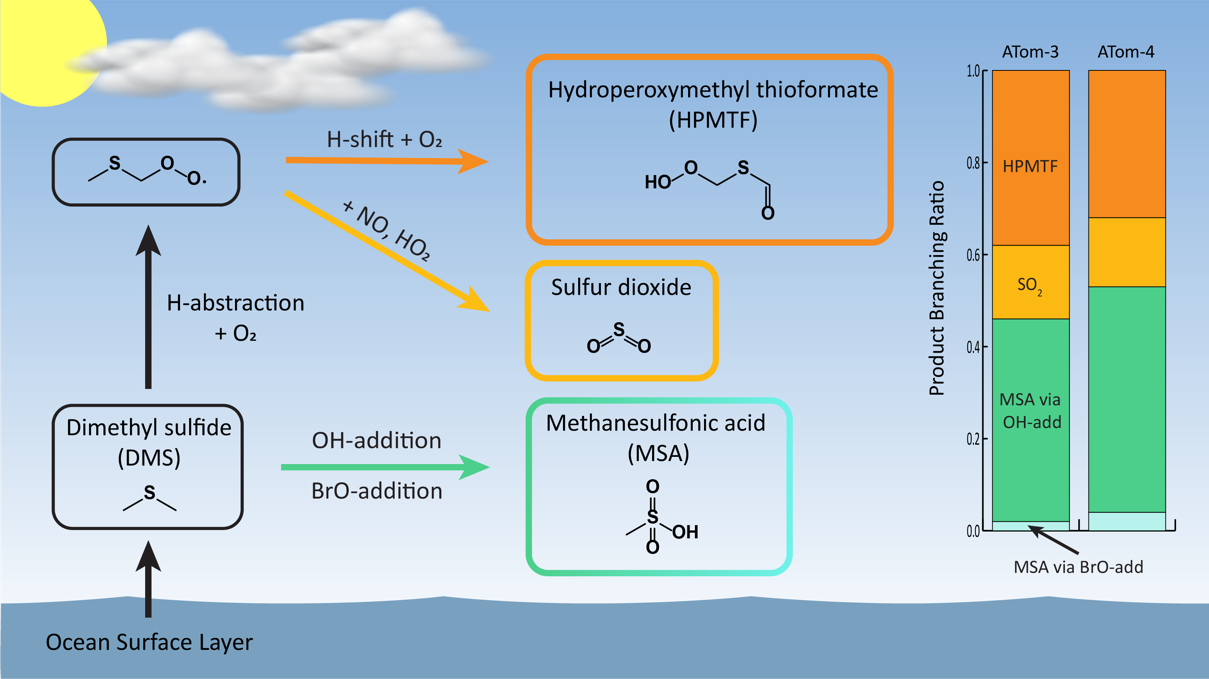
Once in the atmosphere, DMS undergoes radical-initiated oxidation by hydroxyl (OH), halogen radicals (e.g. chlorine, Cl, and bromine oxide, BrO), and the nitrate radical (NO3) to form a suite of oxidation products. Gas phase sulfur dioxide (SO2), one of these oxidation products, can react further to form sulfuric acid (H2SO4), a key precursor to new particles formed via homogeneous nucleation in air masses where the existing condensation sink is small. These newly formed particles may grow by further condensation and coagulation to sizes large enough to serve as cloud condensation nuclei (CCN), thus affecting cloud optical properties and climate. In addition, SO2 and methane sulfonic acid (MSA, CH3SO3H) can partition to aerosol liquid water to form additional non-sea salt sulfate (nss-SO42-).
Despite the crucial role DMS plays as a natural source of aerosol sulfate, parameterizations of the complex oxidation pathways remain insufficient. Previous work has focused almost exclusively on the yields and fate of the terminal products SO2 and MSA and their impact on the concentration of CCN. These observational limitations as well as computational restrictions on global and regional chemical transport models have led to an oversimplification of DMS formation and loss processes, where DMS reactions are typically represented as a binary oxidation reaction to produce SO2 and MSA.
Recent research has confronted this oversimplification through the identification of a previously unidentified DMS oxidation product, hydroperoxymethyl thioformate (HPMTF) highlighted in Figure 10, and quantification of a new, potentially significant source of biogenic marine sulfur, methanethiol. Cloud uptake of HPMTF alone, a previously unidentified loss process for marine sulfur, accounts for a global reduction of approximately 35% in net SO2 production and results significant changes to the spatial distribution of sulfate in marine environments. Additionally, carbonyl sulfide (OCS), a key climate gas through its role as the source of stratospheric aerosol mass, has been recently identified as a product of HPMTF oxidation.
Collectively, these recent discoveries highlight the role of DMS in regulating the temporal and spatial distributions of SO2, H2SO4, and non-sea salt sulfate. The sensitivity of global aerosol radiative forcing simulations to new descriptions of the formation and loss process of marine sulfur motivates further research into the fate of sulfur species in the remote atmosphere. During AEROMMA we will deploy a comprehensive measurement suite capable of detecting both gas and particle phase sulfur species including gas phase observations of HPMTF (Iodide time of flight mass spectrometer, TOF CIMS), DMS and methanethiol (VOCUS-PTR), SO2, and particle phase sulfate and MSA tracers (particle-into-liquid sampler with online ion chromatography, PILS-IC, and a high resolution time of flight aerosol mass spectrometer, HR-AMS). Flight plans will be designed to span a range of meteorological conditions and geographical conditions to provide ample statistics on the impacts of aerosols and clouds on the marine sulfur system.
Figure 10: Proposed biogenic marine sulfur cycle including HPMTF formation.
Marine halogens
The marine atmosphere is the main source of natural halogen-containing (e.g Br, Cl, I) gases. Halogen species originate from a variety of natural processes including reactions on sea salt aerosol (SSA), stratospheric transport, and rapid cycling with inorganic reservoirs. Halogens can impact the oxidative capacity of the atmosphere by altering VOC, NOx and HOx budgets in both coastal urban and pristine marine environments.
Halogen oxides (BrO, ClO, IO) play an important role in the ozone depletion cycle. Halogens have been shown to reduce O3 concentrations in marine environments by up to 20%. Similarly in coastal urban regions, a recent modeling study approximates a 10% increase in secondary organic aerosol and reductions in O3 and NOx in the city of Los Angeles. Conversely, increases in tropospheric ozone and secondary organic aerosol production has been observed as a result of the reaction of ClNO2 on marine aerosols in coastal urban areas. Additional, improved measurements of these key halogen species are required to further quantify their impact on baseline continental O3.
BrO in particular reacts with key atmospheric species such as DMS, HO2, and NOx to activate halogens radicals, form reactive halogen species or yield key reservoir species. Reactions of DMS with BrO have been of recent interest, however, there remains disagreement over the relative impact of this reaction on DMS oxidation. In one recent modeling study, BrO oxidation accounted for up to 46% of the DMS oxidation, however others have suggested significantly lower net impacts, less than 5%. Recent studies have further highlighted the discrepancies between measurements and modeled Cl and BrO abundances, which impacts our ability to accurately describe their impact on DMS chemistry.
Large uncertainties remain in the sources, abundance, and chemical mechanisms of marine sourced halogens. These uncertainties limit our ability to accurately describe the role of halogens on the tropospheric ozone and global NOx and HOx budgets. The AEROMMA study will provide additional field observations of marine halogen species, BrO, ClNO2, Cl2 (I-TOF CIMS), VOCs (VOCUS-PTR), NOx (LIF), and particulate chloride (HR-AMS). These observations will be used to test model descriptions to further constrain the impact of marine halogens on the oxidative budget of urban regions, and to assess the role these emissions on urban air quality in a changing atmosphere.
Marine sources of VOC, NOx, and aerosols, Ozone transport and deposition
The global background concentrations of ozone and the oxidation capacity in remote regions are impacted significantly by air-sea exchange of reactive species such as O3, nitrogen oxides, and trace organics. One key need is to understand the production and chemical or physical loss of O3 over the oceans which controls the present-day baseline continental O3 due to onshore flow, and as well to estimate preindustrial O3. In addition, moderately long-lived climate and ozone active gases such as methane and methyl chloroform are controlled by the hydroxyl radical, which is quite sensitive to the low mixing ratios of nitric oxide over the Earth's marine environments. Trace organic species such as acetaldehyde and isoprene are important reactive carbon reservoirs and indicators of biological processes in the air/sea interface. These organics may act as precursors for organic aerosol formation in pristine areas where models frequently underestimate their abundance.
Measurements of the fluxes of key species including O3, NOx, and marine sourced organics are needed to advance the understanding of air-sea exchange and its impact on the atmosphere. Ozone deposition velocities have been measured in a limited number of locations and can vary widely, but remain an important uncertainty in the marine O3 budget. Additional high-quality measurements of this deposition rate are urgently needed. Nitrogen oxides in pristine marine environments have almost always been measured in higher abundance than can be explained by known sources, which are mostly limited to transport of continental or lightning NOx into the MBL. Numerous mechanisms have been proposed that might act as sources of NOx over the ocean. These include the direct photolytic production of NOx or HONO from photolysis of nitrate in the surface sea waters or in aerosols in the MBL, as well as biotic mechanisms which may be more prevalent in oxygen depletion zones. While differences between modeled and measured NOx have implied a missing marine source, direct flux measurements that could confirm a marine source of NOx have not been reported.
While the NASA Atmospheric Tomography (ATom) mission provided global scale measurements of O3, NOx and some organic compounds, only O3 was measured with sufficient precision to perform eddy-covariance flux calculations. Fast measurements of non-oxygenated organics such as DMS and isoprene, were not available on that mission. In addition, dwell time in the MBL which allowed for some EC-Flux measurements of O3 deposition velocity, were only a minor part of the flight time. In AEROMMA, we will expand our knowledge of air/sea exchange of these species by focusing flight hours on lower altitudes (~500 feet) and stacked flight legs allowing for measurement of the flux divergence near the sea surface. Also available on AEROMMA will be higher precision measurements of NO (LIF) and many organics (Vocus-PTR) which should allow for concurrent flux measurements of the light organics.
Marine aerosols and radiative impacts
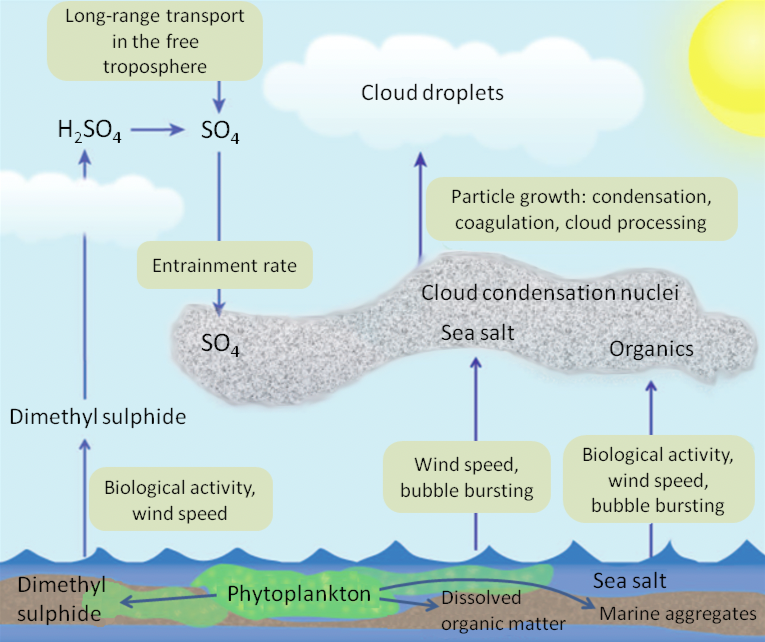
Marine aerosols are produced primarily through three processes: sea-spray, secondary production of sulfate, and secondary production of organics. Marine aerosols can affect the amount of solar radiation reaching the Earth's surface through the production of CCN (Figure 11). The remote marine atmosphere is particularly sensitive to the production of additional CCN due to the low concentrations of CCN in this environment. Production of CCN can dramatically change the number and size of cloud droplets. One study in particular observed a doubling in the cloud droplet number concentration as a result of a marine aerosol production associated with a phytoplankton bloom in the Southern Ocean resulting in a calculated change in the local radiative flux of -15 W m-2. These indirect effects of marine aerosols on clouds remain the largest uncertainty in current IPCC radiative forcing estimates. Therefore, parameterization of the sources of aerosols is important to understanding changes in Earth's radiation balance in response to changes in the burden and properties of these aerosols as a result of a changing climate. In-situ atmospheric measurements with high spatial resolution of MBL aerosol loading and microphysical properties, effects of cloud processing and entrainment of aerosols from the free troposphere and non-sea- salt sulfate, are required are required to improve parameterization of ocean ecosystem-CCN-cloud for Earth system models.
Although direct anthropogenic emissions of SO2 currently dominate indirect biogenic sources on a global scale, natural DMS emissions may have a more important impact on global climate. Anthropogenic SO2 emissions originate primarily from northern midlatitude continental point sources, and the atmospheric lifetime of approximately a few days limits its global impact. DMS on the other hand, is emitted over vast regions of Earth's oceans, and is the main source of particulate sulfate over the majority of the tropical marine boundary layer. These particles in turn play an important role in controlling the albedo of tropical marine cumulus clouds. Global anthropogenic SO2 is expected to continue to decrease as a result of emissions regulation, while emissions of DMS continue to increase in a warming climate, further increasing the relative impact of the DMS fraction of global reactive sulfur in the future.
Globally, the most important source region for new particles is thought to be the tropical free and upper troposphere (UT). Trace gases in this region are primarily transported there via intense tropical deep convection, bringing air from the marine boundary layer into the UT. The small amount of SO2 in this region which is a key ingredient for new particle formation is therefore most likely sourced from oxidation of DMS. Understanding the SO2 yield from DMS oxidation is therefore key to understanding the availability of SO2 for UT aerosol nucleation and growth.
Nucleation and growth of aerosol particles to reach CCN active sizes is a global phenomenon which has control over CCN concentrations in clean environments. Limitations in the understanding of the chemistry controlling aerosol nucleation and growth rates in the cleanest marine environments presents a major uncertainty in the abundance of CCN in preindustrial times and is one of the primary reasons for the current magnitude of uncertainty in aerosol indirect effect on global climate. Observations in regions with limited influence from anthropogenic emissions have demonstrated that NPF can occur in pristine regions near Earth's surface. Many studies conducted in forested regions have demonstrated frequent observations of NPF that are likely due to condensation of species other than H2SO4. Current understanding centers around the idea that low volatility organic compounds may be formed by oxidation of biogenic VOCs, either by organic peroxide formation from RO2 + RO2 chemistry, or from autoxidation processes, both of which can only occur in environments with very low NO concentrations and long peroxy radical lifetimes. A number of studies have demonstrated that NPF at some coastal sites is associated with iodine chemistry occurring during exposure of algal species at low tide. However, characterization of NPF over the open ocean which might be of clear global importance is lacking.
Research presented anecdotal evidence from observations during ATom that biogenic sulfur chemistry very likely results in new particle formation in outflow regions of marine cloud decks. However, a comprehensive suite of measurements and significant dwell time observing aerosol nucleation and growth was not possible during ATom. An understanding of MBL new particle formation (NPF) sufficient for implementation into global climate models would require detailed in-situ observations that could fully track NPF events in time and characterize their chemistry well enough to confidently constrain a useful parameterization.
The chemical and microphysical payload that will be deployed for AEROMMA will provide a much more detailed characterization of the chemical mechanisms of NPF in the marine atmosphere. During AEROMMA we will target the sampling of regions over the open ocean likely to experience NPF, such as open cell cloud structures, and dwell sufficiently long in those regions to derive aerosol nucleation and growth rates. Such a sampling strategy is challenging because NPF events are inherently fleeting and will require real-time guidance based on satellite imagery of locations that appear likely to provide the conditions for those events. The gas-phase chemical observations available will allow for identification of the role specific species, such as DMS oxidation products, play in the nucleation or growth periods of NPF.
Figure 11: Linkages between air-sea exchange and the production of CCN in the remote marine atmosphere.
Spaceborne atmospheric composition capabilities during AEROMMA
Current and planned geostationary satellite observations
NOAA's Geostationary Operational Environmental Satellite (GOES) - R Series weather satellites are currently in geostationary orbit over North America. The first two of the four satellites have been launched; GOES-16 (East) and GOES-17 (West) are operational since 2017 and 2019, respectively. The onboard Advanced Baseline Imager (ABI) consists of 16 spectral bands in the visible, near-infrared and infrared, and "tracks and monitors cloud formation, atmospheric motion, convection, land surface temperature, ocean dynamics, flow of water, fire, smoke, volcanic ash plumes, aerosols and air quality, and vegetative health." The GOES-16/GOES-17 satellite imagery from ABI is able to scan the Continental US and Pacific US (including Hawaii) at 0.5 - 2 km spatial resolution every five minutes and can be used to identify areas of cloudy and cloud-free scenes over continental, coastal, and remote marine atmospheres.
GOES-16 and 17 satellite imagery were used extensively during past aircraft missions such as NOAA/NASA Fire Influence on Regional to Global Environments and Air Quality (FIREX-AQ 2019) and the Atlantic Tradewind Ocean-Atmosphere Mesoscale Interaction Campaign (ATOMIC 2020) for flight planning. Smoke plume images were used to direct the NASA DC-8, the NOAA Twin Otter, and the NASA ER-2 to the fires in the western US wildfires and detections of small fires were used to find agricultural burns with the NASA DC-8 in the southeastern US. In addition, research used GOES-16 satellite imagery for coordinated airborne and shipborne measurements during ATOMIC 2020. The measurements and satellite imagery were used to improve the model representation of clouds from small shallow "sugar" to wide deep "flower" clouds. In addition to detecting clouds and smoke, efforts have been made to retrieve atmospheric composition data, including diurnally-varying aerosol optical depth (AOD) from GOES-16.
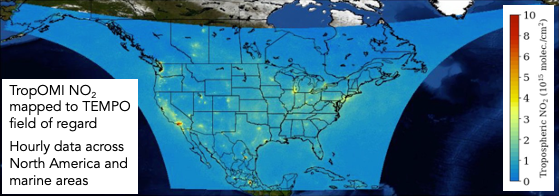
TEMPO (Tropospheric Emissions: Monitoring Pollution) is a NASA earth venture instrument that is anticipated to be launched on a commercial payload in January 2023 and be operational in-time for AEROMMA. TEMPO will be launched into geostationary orbit over North America, and joins a geostationary constellation of air pollution monitoring satellites over Europe (Sentinel 4) and Asia (GEMS). By being in geostationary orbit, TEMPO will provide up to hourly observations over North America during the daytime at approximately 8.4 km x 4.4 km at the center of the field of regard(see Figure 12 for domain coverage and spatial resolution of NO2 hotspots expected to be detected across the day). The TEMPO instrument measures in the ultraviolet and visible (290-490 nm, 540-740 nm) spectrum. Species and data products that TEMPO will be able to detect, include many species relevant to urban air quality, including columns of surface and total O3, NO2, formaldehyde, glyoxal, SO2, and aerosol optical depth (AOD). TEMPO will also measure select reactive halogens, such as bromine oxide (BrO) present in the marine boundary layer. Existing algorithms used to derive aerosol layer height from space-borne observations will be extended to TEMPO.
Figure 12: Tropospheric NO2 from TropOMI on the TEMPO field of regard which includes most of the AEROMMA study region.
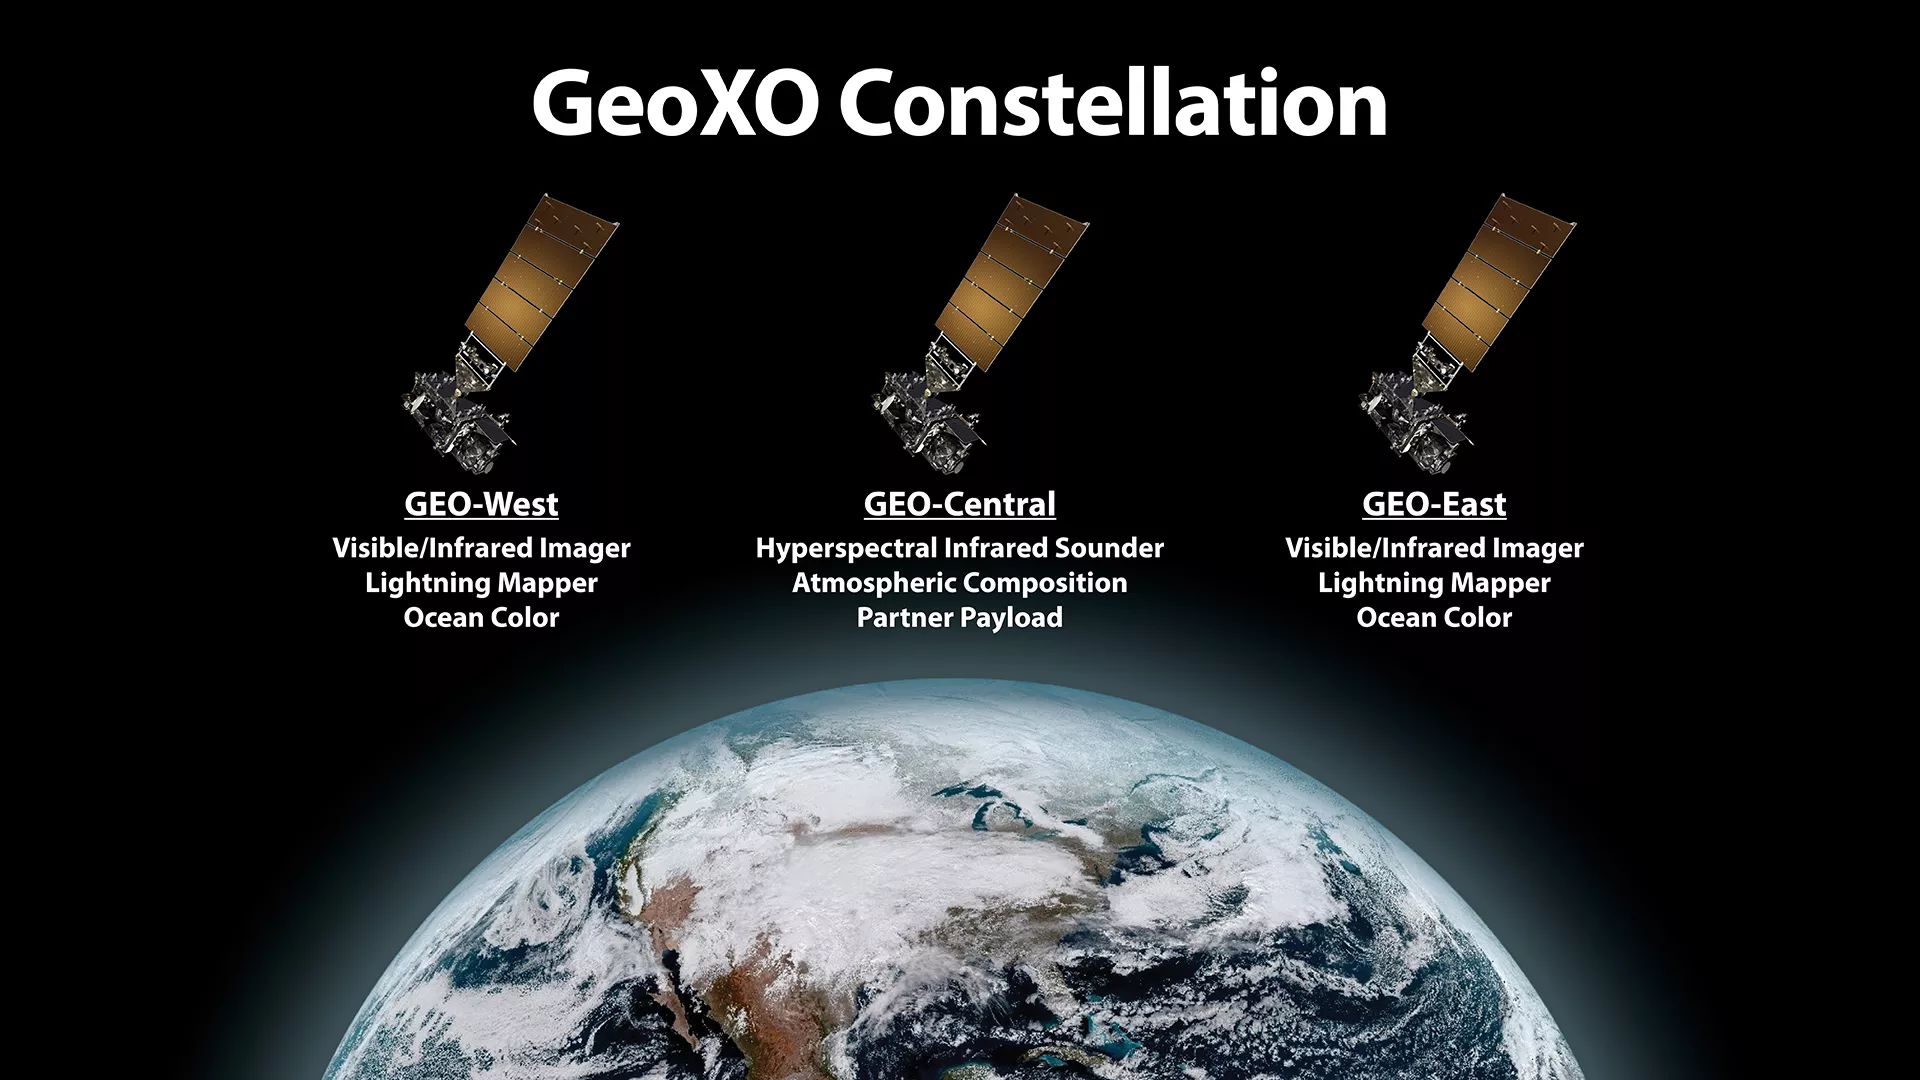
Currently, NOAA is planning the successor to the GOES-R series of satellites with the Geostationary Extended Observations (GeoXO) satellite system to be launched in the 2030s. The GeoXO constellation will continue existing capabilities of GOES-R and also proposes new recommended capabilities addressing environmental challenges associated with weather, oceans, and climate. Core capabilities that will continue include the visible/infrared imager. New recommended capabilities relevant to AEROMMA include Atmospheric Composition, Hyperspectral Infrared Sounder, and Ocean Color Imager.
Figure 13: The GeoXO constellation planned for 2030 and beyond.
The recommended capabilities of the Atmospheric Composition instrument is a UV-VIS spectrometer similar in specifications to TEMPO. It is important to note that capabilities of monitoring atmospheric composition are not limited to species in the UV-visible spectrum alone, but also in the shortwave-IR, midwave-IR, and thermal-IR. Many trace gases can be retrieved from the IASI/MetOp sounder, which include greenhouse gases (e.g., CO2, CH4, N2O), carbon monoxide (CO), and reactive gases (e.g., SO2 , NH3, VOCs such as CFCs, OCS, ethene, methanol, formic acid, and PAN). Airborne data collected from AEROMMA will provide insights into what might be observed from a Hyperspectral Infrared Sounder and/or partner payload with short- to thermal-IR capabilities, in conjunction with trace gas and aerosol species remotely sensed by a UV-VIS Atmospheric Composition instrument. This will also provide insights into extending capabilities of the Joint Polar Satellite System (JPSS) Cross-track Infrared Sounder (CrIS).
Geostationary and Polar-Orbiting satellite science
Polar-orbiting satellites provide global coverage of trace gases and aerosols at midday, which complement observations from geostationary satellites over targeted domains. To date, polar-orbiting satellites have helped improve understanding of emission sources and trends, and nonlinear chemical processes. NOAA CSL scientists have contributed to studies using TROPOMI NO2 to constrain urban and background sources of US NOx emissions, evaluate changes in NOx due to COVID-19, and assess inequality in NO2 exposures. Research illustrated the importance of high-resolution a-priori profiles of formaldehyde for spaceborne observations over the Los Angeles basin. Modeling of the New York City region suggested the potential of remotely sensed peroxyacetyl nitrate (PAN) along with formaldehyde to constrain anthropogenic VOC emissions. NOAA CSL field campaign data have been used to advance new retrievals of reactive VOCs from CrIS, including isoprene. CrIS retrievals have helped reveal the importance of vehicular sources of ammonia in Los Angeles. Lastly, TROPOMI NO2 and CH4 retrievals illustrate the intersection of co-emitted air pollutants and greenhouse gases, including over oil and gas fields. Spaceborne atmospheric composition capabilities have advanced greatly, and the AEROMMA campaign will help ensure continued advancement of satellite algorithms of trace gases and aerosols, and improved model representations of emissions and chemistry over the North American continent.
Evaluating satellite retrievals
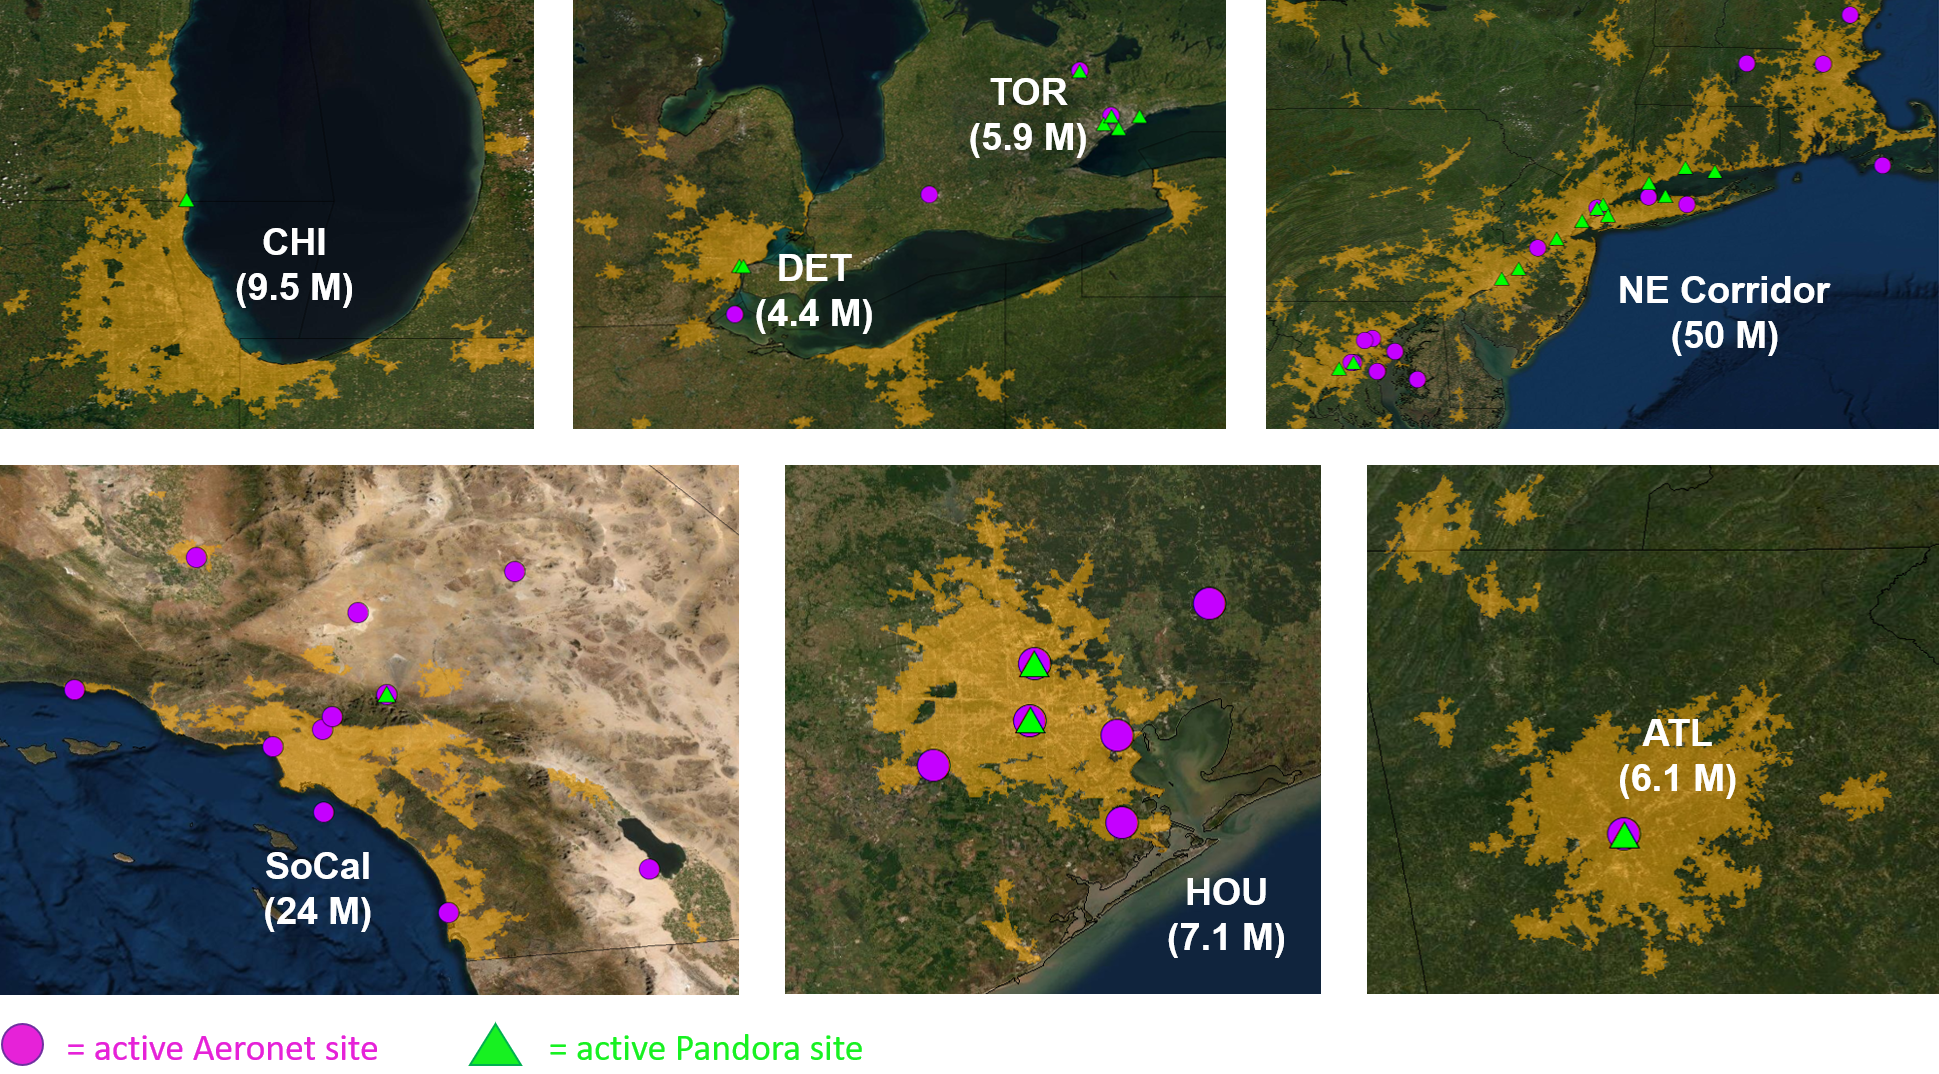
Ground-based networks of remote sensors, including Pandonia Global Network and AERONET provide a robust dataset that can be used to characterize uncertainties in satellite retrievals of trace gases and aerosols. Figure 14 shows Pandora and AERONET sites, located in urban regions that will be targeted by AEROMMA, that are currently operational within the TEMPO field of view, and which all retrieve columns of NO2 and O3, and some SO2 and formaldehyde. The AERONET sites retrieve aerosol optical depth (AOD).
Figure 14. Sites that are currently active from Aeronet (purple) and Pandora (green) located in the AEROMMA target city regions.
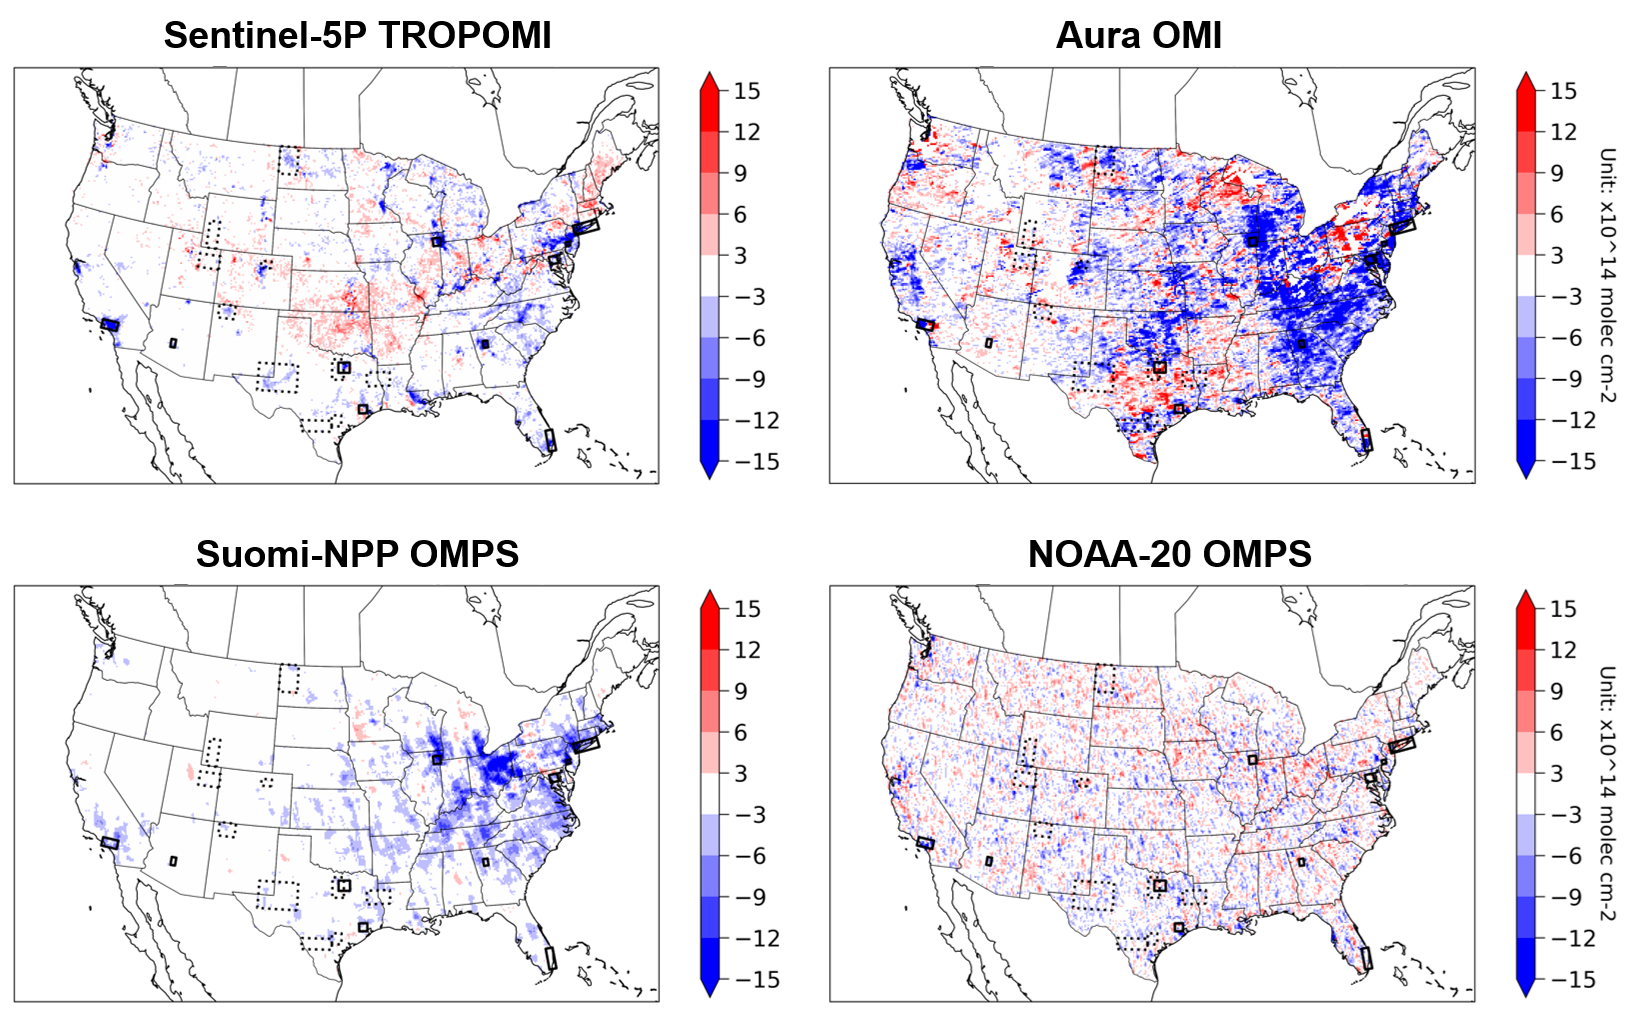
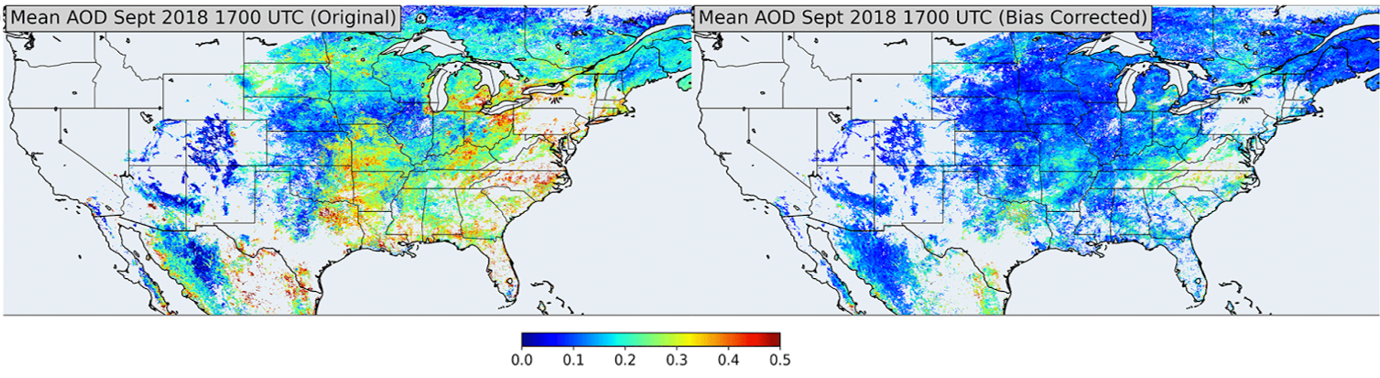
Figure 15 shows four different satellite products over North America detecting changes in tropospheric NO2 columns during the COVID-19 lockdown period. The four different satellite instruments clearly do not agree well on their observations on how NO2 changed due to lockdown measures. Research demonstrated the importance of bias-correcting GOES-16 AOD retrieval using empirical observations from AERONET (Figure 15, bottom). These two examples highlight the critical importance of field-intensive data, along with ground-based remote sensing networks, to evaluate and improve satellite retrievals of atmospheric composition.
Figure 15. (top) Change in tropospheric NO2 columns over the US comparing the COVID-19 lockdown period (April 2020) relative to the previous year (April 2019). The differences are shown from four concurrent satellite instruments. (bottom) GOES-16 ABI AOD without and with empirical bias correction.
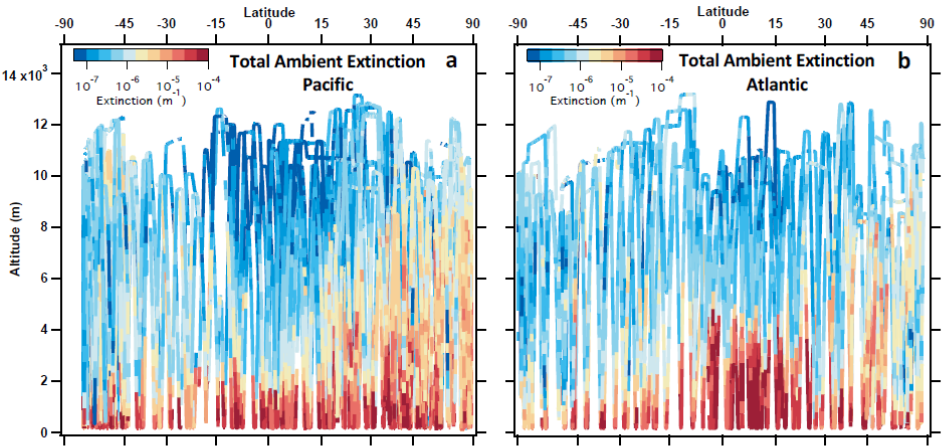
Over the remote ocean, airborne measurements from the Atmospheric Tomography Mission (ATom) have been used to evaluate satellite retrievals of AOD. Research derived aerosol extinction profiles and AOD by combining in-situ aerosol measurements of dry size distribution, ambient size distribution, single particle composition, bulk composition, black carbon, and water-soluble brown carbon, along with meteorological parameters (H2O, temperature, pressure) and compositional, hygroscopic growth, and optical models (see Figure 16). From the in-situ derived aerosol extinction profiles, the sources of aerosols can also be distinguished, including biomass burning, sulfate/organic aerosol, sea salt, and dust. This helps to improve evaluation of satellite AOD products, such as from the Suomi-NPP Visible Infrared Imaging Radiometer Suite (VIIRS). Improving satellite AOD products and understanding sources of aerosols over open and coastal ocean helps increase confidence in ingesting satellite AOD for NOAA global forecast models.
Figure 16. (top) Aerosol extinction profiles derived from in-situ airborne instrumentation on-board the NASA DC-8 during the ATom field campaign. (bottom) Evaluation of AOD derived from airborne data with Suomi-NPP/VIIRS AOD products.
NOAA User Readiness Plan
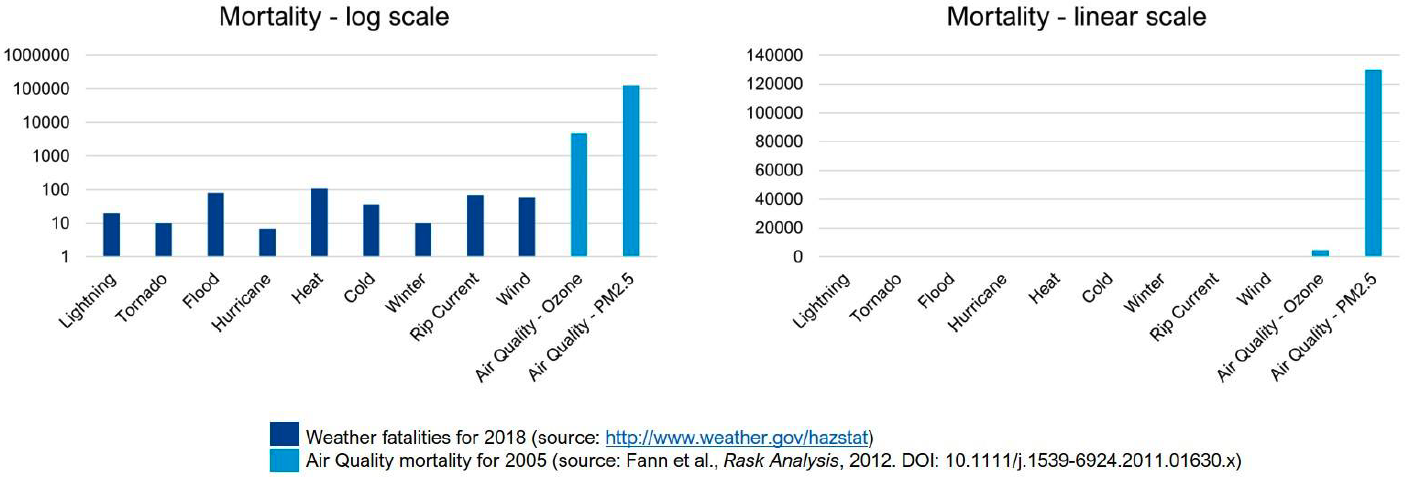
In its value assessment of atmospheric composition capabilities, NOAA outlined 7 application areas on: (1) Air Quality Forecasting, (2) Weather and Climate Forecasting, (3) Fire Weather Forecasting, (4) Hazards Forecasting, (5) Stratospheric Ozone Monitoring, (6) Greenhouse Gas Monitoring, and (7) Air Quality Monitoring. The data collected from AEROMMA across both megacity and marine environments will provide data that will inform GeoXO and demonstrate its potential to contribute to several of these application areas, including on air quality forecasting, weather and climate forecasting, greenhouse gas monitoring, and air quality monitoring. AEROMMA provides the first opportunity to assess the enhanced capabilities of TEMPO to monitor air pollution over the continental US and explore whether data delivered can be utilized in operational air quality forecasting. In partnership with the US Environmental Protection Agency, NOAA issues forecast guidance and warns the public of poor air quality episodes through its National Air Quality Forecast Capability (NAQFC), which is part of the Unified Forecast System (UFS). Figure 17 highlights the importance of advancing the NAQFC. In the US, annually over 100,000 premature deaths are associated with enhanced ozone and PM2.5, and greatly exceeds the number of deaths associated with other weather-related fatalities amounting to 500 per year combined.
Figure 17: The U.S. weather mortality rates. Figure: GeoXO Value Assessment, 2020
Field data collected over the marine atmosphere will also aid Earth System Models developed by the NOAA Geophysical Fluid Dynamics Laboratory, by improving oceanic emissions and chemical processes that affect chemistry-climate interactions. Measurements over the North American continent will also help improve anthropogenic and biogenic emissions that affect climate, and provide observations that leverage global-to-regional refinement capabilities of the Finite Volume Cubed-Sphere (FV3) dynamical core.
Proving Ground Risk Reduction of Geostationary Satellite Observations
Because TEMPO is a new satellite instrument with hourly observing capabilities of air pollution unseen over North America, it is important to prove the advanced capabilities of TEMPO and reduce risk of utilizing satellite data for forecasting and regulatory applications by characterizing uncertainties. Specifically, it is important to characterize uncertainty in relating satellite slant columns to surface concentrations. Along with TEMPO, uncertainties of polar-orbiting satellites can be characterized simultaneously. Suborbital airborne campaigns, needed to reduce uncertainties of satellite column retrievals over both the North American megacities and marine environments, consist of:
heavy-lift long-duration in-situ research aircraft (NASA DC-8) with a full trace gas and aerosol instrument payload, to reduce uncertainty in vertical structure and optical properties of trace gases and aerosols observed by atmospheric composition satellites, and
small airborne remote sensing platforms (NASA GV, NOAA Twin Otter) to reduce uncertainty in high spatial/temporal patterns of trace gases and aerosols observed by atmospheric composition satellites.
New measurement capabilities of TEMPO
TEMPO will provide diel variation of trace gases and aerosol columns, which will allow for new science, but also may have needs for understanding how the retrievals work as a function of solar zenith angle, especially for early and late day measurements. Aircraft profiles are needed for characterization of columns and boundary layer structure throughout the whole TEMPO field of regard and throughout the whole day.
NO2, AOD, and CH2O are the most standard trace gas products from current polar orbiters, but TEMPO aims to measure more, including 0–2 km and free tropospheric O3, CHOCHO, SO2 , and potentially even compounds like HONO and NO3. AEROMMA will have the measurement capabilities for all the TEMPO standard and extended products, which can be used to support the development of the enhanced capabilities from TEMPO.